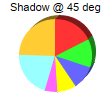
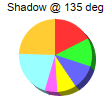
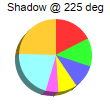
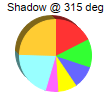
This example demonstrates an alternative 3D drawing method that uses shadows.
The standard way to draw a pie chart in 3D is to view the chart from an inclined angle. Using this method, the surface of a 3D pie will become an ellipse.
ChartDirector supports an alternative way to draw a pie chart in 3D - to draw the 3D portion like a shadow. The 3D pie will remain perfectly circular, and the sector areas will correctly reflect its percentages.
The 3D drawing method is configured using
PieChart.set3D.
pythondemo\shadowpie.py
#!/usr/bin/python

# The ChartDirector for Python module is assumed to be in "../lib"
import sys, os
sys.path.insert(0, os.path.join(os.path.abspath(sys.path[0]), "..", "lib"))

from pychartdir import *

def createChart(chartIndex) :

    # the tilt angle of the pie
    angle = chartIndex * 90 + 45

    # The data for the pie chart
    data = [25, 18, 15, 12, 8, 30, 35]

    # Create a PieChart object of size 110 x 110 pixels
    c = PieChart(110, 110)

    # Set the center of the pie at (50, 55) and the radius to 36 pixels
    c.setPieSize(55, 55, 36)

    # Set the depth, tilt angle and 3D mode of the 3D pie (-1 means auto depth, "true" means the 3D
    # effect is in shadow mode)
    c.set3D(-1, angle, 1)

    # Add a title showing the shadow angle
    c.addTitle("Shadow @ %s deg" % (angle), "Arial", 8)

    # Set the pie data
    c.setData(data)

    # Disable the sector labels by setting the color to Transparent
    c.setLabelStyle("", 8, Transparent)

    # Output the chart
    c.makeChart("shadowpie%s.png" % chartIndex)


createChart(0)
createChart(1)
createChart(2)
createChart(3)
© 2021 Advanced Software Engineering Limited. All rights reserved.