This example extends the
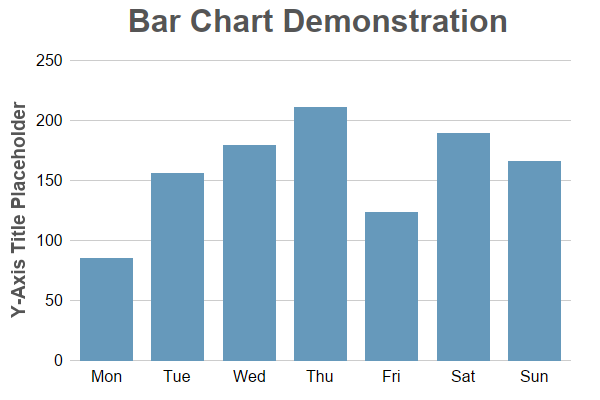
Simple Bar Chart (1) example to demonstrates various methods to control the chart appearance and to add titles.
- Use XYChart.setPlotArea to configure the plot area to have transparent border and light grey (CCCCCC) grid lines.
- Use BaseChart.addTitle and Axis.setTitle to add chart and axis titles.
- Use Axis.setColors to set the axis stem and ticks to Transparent.
- Use Axis.setLabelStyle to set the label style to grey 12pt Arial.
- Use XYChart.addBarLayer to add a bar layer with light navy blue color (6699BB).
- Use Layer.setBorderColor to configure the border color to Transparent to disable the bar border.
- Use Axis.setTickDensity to configure a minimum label spacing for automatically generated labels. Although a chart will be more precise with more axis labels so long as they do not overlap, sometimes less labels are desirable for aesthetic reasons. Setting the minimum label spacing can control the label density without knowing how many labels would be produced (which depends on actual data).
pythondemo\simplebar2.py
#!/usr/bin/python

# The ChartDirector for Python module is assumed to be in "../lib"
import sys, os
sys.path.insert(0, os.path.join(os.path.abspath(sys.path[0]), "..", "lib"))

from pychartdir import *

# The data for the bar chart
data = [85, 156, 179, 211, 123, 189, 166]

# The labels for the bar chart
labels = ["Mon", "Tue", "Wed", "Thu", "Fri", "Sat", "Sun"]

# Create a XYChart object of size 600 x 400 pixels
c = XYChart(600, 400)

# Add a title box using grey (0x555555) 24pt Arial Bold font
c.addTitle("    Bar Chart Demonstration", "Arial Bold", 24, 0x555555)

# Set the plotarea at (70, 60) and of size 500 x 300 pixels, with transparent background and border
# and light grey (0xcccccc) horizontal grid lines
c.setPlotArea(70, 60, 500, 300, Transparent, -1, Transparent, 0xcccccc)

# Set the x and y axis stems to transparent and the label font to 12pt Arial
c.xAxis().setColors(Transparent)
c.yAxis().setColors(Transparent)
c.xAxis().setLabelStyle("Arial", 12)
c.yAxis().setLabelStyle("Arial", 12)

# Add a blue (0x6699bb) bar chart layer with transparent border using the given data
c.addBarLayer(data, 0x6699bb).setBorderColor(Transparent)

# Set the labels on the x axis.
c.xAxis().setLabels(labels)

# For the automatic y-axis labels, set the minimum spacing to 40 pixels.
c.yAxis().setTickDensity(40)

# Add a title to the y axis using dark grey (0x555555) 14pt Arial Bold font
c.yAxis().setTitle("Y-Axis Title Placeholder", "Arial Bold", 14, 0x555555)

# Output the chart
c.makeChart("simplebar2.png")
© 2021 Advanced Software Engineering Limited. All rights reserved.