This example demonstrates the basic steps in creating line charts.
- Create an XYChart object using XYChart.XYChart.
- Specify the plot area of the chart using XYChart.setPlotArea. The plot area is the rectangle bounded by the x and y axes. You should leave some margin on the outside of the plot area for axis labels, chart titles, etc.
- Specify the labels on the x-axis using Axis.setLabels.
- A line chart may contain many points and therefore many x-axis labels. In this example, Axis.setLabelStep is used to specify showing only a subset of the labels on the x-axis to avoid over-crowding.
- Add a line layer and specify the data for the line using XYChart.addLineLayer.
- Generate the chart using BaseChart.makeChart.
- Generate tool tips for the chart using BaseChart.getHTMLImageMap.
pythondemo\simpleline.py
#!/usr/bin/python
# The ChartDirector for Python module is assumed to be in "../lib"
import sys, os
sys.path.insert(0, os.path.join(os.path.abspath(sys.path[0]), "..", "lib"))
from pychartdir import *
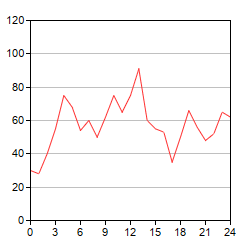
# The data for the line chart
data = [30, 28, 40, 55, 75, 68, 54, 60, 50, 62, 75, 65, 75, 91, 60, 55, 53, 35, 50, 66, 56, 48, 52,
65, 62]
# The labels for the line chart
labels = ["0", "1", "2", "3", "4", "5", "6", "7", "8", "9", "10", "11", "12", "13", "14", "15",
"16", "17", "18", "19", "20", "21", "22", "23", "24"]
# Create a XYChart object of size 250 x 250 pixels
c = XYChart(250, 250)
# Set the plotarea at (30, 20) and of size 200 x 200 pixels
c.setPlotArea(30, 20, 200, 200)
# Add a line chart layer using the given data
c.addLineLayer(data)
# Set the labels on the x axis.
c.xAxis().setLabels(labels)
# Display 1 out of 3 labels on the x-axis.
c.xAxis().setLabelStep(3)
# Output the chart
c.makeChart("simpleline.png")
© 2021 Advanced Software Engineering Limited. All rights reserved.