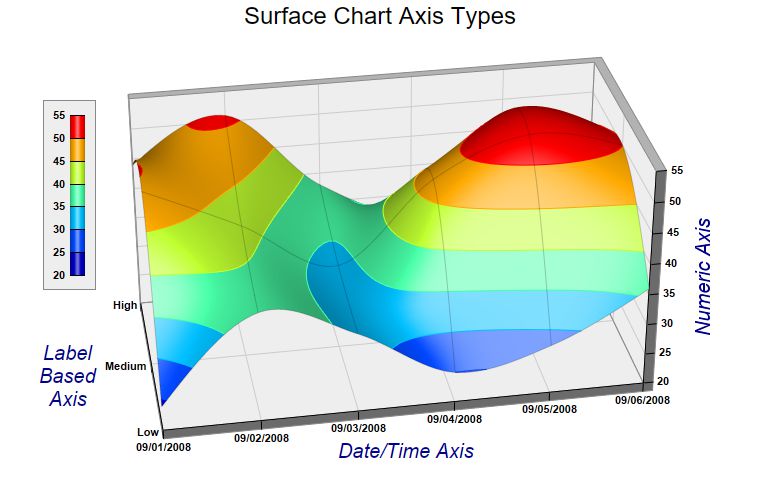
The example demonstrates different axis scale types for the surface charts.
Like an
XYChart, in a
SurfaceChart, the axis scale can represent numbers, date/time or labels. In this example, the x-axis uses a date/time scale, the y-axis uses a label based scale, and the z-axis uses a numeric scale.
pythondemo\surfaceaxis.py
#!/usr/bin/python

# The ChartDirector for Python module is assumed to be in "../lib"
import sys, os
sys.path.insert(0, os.path.join(os.path.abspath(sys.path[0]), "..", "lib"))

from pychartdir import *

# The x and y coordinates of the grid
dataX = [chartTime(2008, 9, 1), chartTime(2008, 9, 2), chartTime(2008, 9, 3), chartTime(2008, 9, 4),
    chartTime(2008, 9, 5), chartTime(2008, 9, 6)]
dataY = ["Low", "Medium", "High"]

# The data series
lowData = [24, 38, 33, 25, 28, 36]
mediumData = [49, 42, 34, 47, 53, 50]
highData = [44, 51, 38, 33, 47, 42]

# Create a SurfaceChart object of size 760 x 500 pixels
c = SurfaceChart(760, 500)

# Add a title to the chart using 18 points Arial font
c.addTitle("Surface Chart Axis Types", "Arial", 18)

# Set the center of the plot region at (385, 240), and set width x depth x height to 480 x 240 x 240
# pixels
c.setPlotRegion(385, 240, 480, 240, 240)

# Set the elevation and rotation angles to 30 and -10 degrees
c.setViewAngle(30, -10)

# Set the data to use to plot the chart. As the y-data are text strings (enumerated), we will use an
# empty array for the y-coordinates. For the z data series, they are just the concatenation of the
# individual data series.
c.setData(dataX, None, ArrayMath(lowData).insert(mediumData).insert(highData).result())

# Set the y-axis labels
c.yAxis().setLabels(dataY)

# Set x-axis tick density to 75 pixels. ChartDirector auto-scaling will use this as the guideline
# when putting ticks on the x-axis.
c.xAxis().setTickDensity(75)

# Spline interpolate data to a 80 x 40 grid for a smooth surface
c.setInterpolation(80, 40)

# Set surface grid lines to semi-transparent black (cc000000).
c.setSurfaceAxisGrid(0xcc000000)

# Set contour lines to the same color as the fill color at the contour level
c.setContourColor(SameAsMainColor)

# Add a color axis (the legend) in which the top right corner is anchored at (95, 100). Set the
# length to 160 pixels and the labels on the left side.
cAxis = c.setColorAxis(95, 100, TopRight, 160, Left)

# Add a bounding box with light grey (eeeeee) background and grey (888888) border.
cAxis.setBoundingBox(0xeeeeee, 0x888888)

# Set label style to Arial bold for all axes
c.xAxis().setLabelStyle("Arial Bold")
c.yAxis().setLabelStyle("Arial Bold")
c.zAxis().setLabelStyle("Arial Bold")
c.colorAxis().setLabelStyle("Arial Bold")

# Set the x, y and z axis titles using deep blue (000088) 15 points Arial font
c.xAxis().setTitle("Date/Time Axis", "Arial Italic", 15, 0x000088)
c.yAxis().setTitle("Label\nBased\nAxis", "Arial Italic", 15, 0x000088)
c.zAxis().setTitle("Numeric Axis", "Arial Italic", 15, 0x000088)

# Output the chart
c.makeChart("surfaceaxis.jpg")
© 2021 Advanced Software Engineering Limited. All rights reserved.