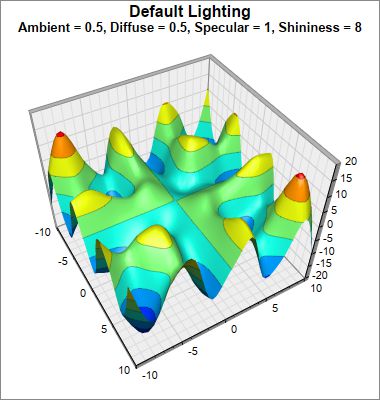
This example demonstrates the effects of various surface lighting parameters, configured using SurfaceChart.setLighting.
ChartDirector 7.0 (Python Edition)
Surface Lighting
Source Code Listing
#!/usr/bin/python
# The ChartDirector for Python module is assumed to be in "../lib"
import sys, os
sys.path.insert(0, os.path.join(os.path.abspath(sys.path[0]), "..", "lib"))
from pychartdir import *
import math
def createChart(chartIndex) :
# The x and y coordinates of the grid
dataX = [-10, -8, -6, -4, -2, 0, 2, 4, 6, 8, 10]
dataY = [-10, -8, -6, -4, -2, 0, 2, 4, 6, 8, 10]
# The values at the grid points. In this example, we will compute the values using the formula z
# = x * sin(y) + y * sin(x).
dataZ = [0] * (len(dataX) * len(dataY))
for yIndex in range(0, len(dataY)) :
y = dataY[yIndex]
for xIndex in range(0, len(dataX)) :
x = dataX[xIndex]
dataZ[yIndex * len(dataX) + xIndex] = x * math.sin(y) + y * math.sin(x)
# Create a SurfaceChart object of size 380 x 400 pixels, with white (ffffff) background and grey
# (888888) border.
c = SurfaceChart(380, 400, 0xffffff, 0x888888)
# Demonstrate various lighting parameters
if chartIndex == 0 :
c.addTitle(
"Default Lighting<*br*><*size=10*>Ambient = 0.5, Diffuse = 0.5, Specular = 1, " \
"Shininess = 8")
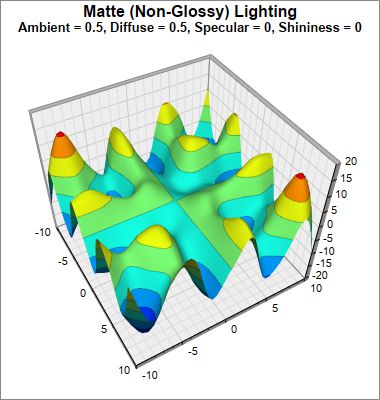
elif chartIndex == 1 :
c.addTitle(
"Matte (Non-Glossy) Lighting<*br*><*size=10*>Ambient = 0.5, Diffuse = 0.5, Specular " \
"= 0, Shininess = 0")
c.setLighting(0.5, 0.5, 0, 0)
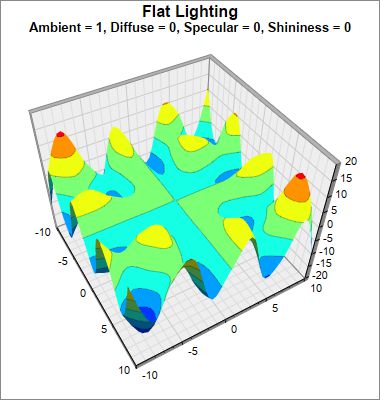
elif chartIndex == 2 :
c.addTitle(
"Flat Lighting<*br*><*size=10*>Ambient = 1, Diffuse = 0, Specular = 0, Shininess = 0")
c.setLighting(1, 0, 0, 0)
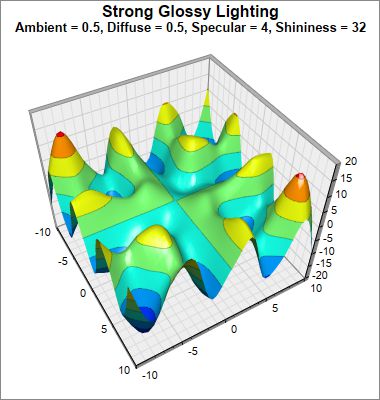
else :
c.addTitle(
"Strong Glossy Lighting<*br*><*size=10*>Ambient = 0.5, Diffuse = 0.5, Specular = 4, " \
"Shininess = 32")
c.setLighting(0.5, 0.5, 4, 32)
# Set the center of the plot region at (175, 200), and set width x depth x height to 200 x 200 x
# 160 pixels
c.setPlotRegion(175, 200, 200, 200, 160)
# Set the plot region wall thichness to 5 pixels
c.setWallThickness(5)
# Set the elevation and rotation angles to 45 and 60 degrees
c.setViewAngle(45, 60)
# Set the perspective level to 35
c.setPerspective(35)
# Set the data to use to plot the chart
c.setData(dataX, dataY, dataZ)
# Spline interpolate data to a 50 x 50 grid for a smooth surface
c.setInterpolation(50, 50)
# Set contour lines to semi-transparent black (c0000000)
c.setContourColor(0xc0000000)
# Output the chart
c.makeChart("surfacelighting%s.jpg" % chartIndex)
createChart(0)
createChart(1)
createChart(2)
createChart(3)