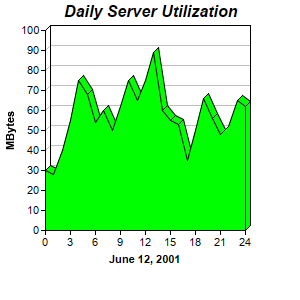
This example demonstrates a 3D area chart configured using Layer.set3D.
ChartDirector 7.0 (Python Edition)
3D Area Chart
Source Code Listing
#!/usr/bin/python

# The ChartDirector for Python module is assumed to be in "../lib"
import sys, os
sys.path.insert(0, os.path.join(os.path.abspath(sys.path[0]), "..", "lib"))

from pychartdir import *

# The data for the area chart
data = [30, 28, 40, 55, 75, 68, 54, 60, 50, 62, 75, 65, 75, 89, 60, 55, 53, 35, 50, 66, 56, 48, 52,
    65, 62]

# The labels for the area chart
labels = ["0", "1", "2", "3", "4", "5", "6", "7", "8", "9", "10", "11", "12", "13", "14", "15",
    "16", "17", "18", "19", "20", "21", "22", "23", "24"]

# Create a XYChart object of size 300 x 300 pixels
c = XYChart(300, 300)

# Set the plotarea at (45, 30) and of size 200 x 200 pixels
c.setPlotArea(45, 30, 200, 200)

# Add a title to the chart using 12pt Arial Bold Italic font
c.addTitle("Daily Server Utilization", "Arial Bold Italic", 12)

# Add a title to the y axis
c.yAxis().setTitle("MBytes")

# Add a title to the x axis
c.xAxis().setTitle("June 12, 2001")

# Add a green (0x00ff00) 3D area chart layer using the give data
c.addAreaLayer(data, 0x00ff00).set3D()

# Set the labels on the x axis.
c.xAxis().setLabels(labels)

# Display 1 out of 3 labels on the x-axis.
c.xAxis().setLabelStep(3)

# Output the chart
c.makeChart("threedarea.png")