pythondemo\threedstackarea.py
#!/usr/bin/python
# The ChartDirector for Python module is assumed to be in "../lib"
import sys, os
sys.path.insert(0, os.path.join(os.path.abspath(sys.path[0]), "..", "lib"))
from pychartdir import *
# The data for the area chart
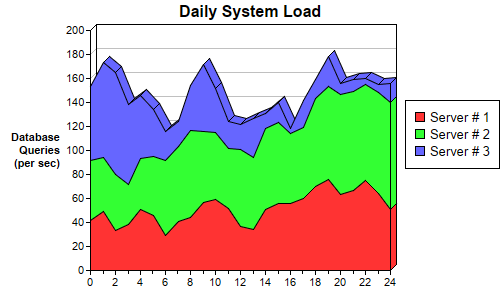
data0 = [42, 49, 33, 38, 51, 46, 29, 41, 44, 57, 59, 52, 37, 34, 51, 56, 56, 60, 70, 76, 63, 67, 75,
64, 51]
data1 = [50, 45, 47, 34, 42, 49, 63, 62, 73, 59, 56, 50, 64, 60, 67, 67, 58, 59, 73, 77, 84, 82, 80,
84, 89]
data2 = [61, 79, 85, 66, 53, 39, 24, 21, 37, 56, 37, 22, 21, 33, 13, 17, 4, 23, 16, 25, 9, 10, 5, 7,
16]
labels = ["0", "1", "2", "3", "4", "5", "6", "7", "8", "9", "10", "11", "12", "13", "14", "15",
"16", "17", "18", "19", "20", "21", "22", "23", "24"]
# Create a XYChart object of size 500 x 300 pixels
c = XYChart(500, 300)
# Set the plotarea at (90, 30) and of size 300 x 240 pixels.
c.setPlotArea(90, 30, 300, 240)
# Add a legend box at (405, 100)
c.addLegend(405, 100)
# Add a title to the chart
c.addTitle("Daily System Load")
# Add a title to the y axis. Draw the title upright (font angle = 0)
c.yAxis().setTitle("Database\nQueries\n(per sec)").setFontAngle(0)
# Set the labels on the x axis.
c.xAxis().setLabels(labels)
# Display 1 out of 2 labels on the x-axis. Show minor ticks for remaining labels.
c.xAxis().setLabelStep(2, 1)
# Add an area layer
layer = c.addAreaLayer()
# Draw the area layer in 3D
layer.set3D()
# Add the three data sets to the area layer
layer.addDataSet(data0, -1, "Server # 1")
layer.addDataSet(data1, -1, "Server # 2")
layer.addDataSet(data2, -1, "Server # 3")
# Output the chart
c.makeChart("threedstackarea.png")
© 2021 Advanced Software Engineering Limited. All rights reserved.