The example demonstrates various tree map layout methods configurable using TreeMapNode.setLayoutMethod.
ChartDirector 7.0 (Python Edition)
Tree Map Layout
Source Code Listing
#!/usr/bin/python
# The ChartDirector for Python module is assumed to be in "../lib"
import sys, os
sys.path.insert(0, os.path.join(os.path.abspath(sys.path[0]), "..", "lib"))
from pychartdir import *
def createChart(chartIndex) :
# Random data for the tree map
r = RanSeries(3)
data = r.getSeries(20, 20, 400)
# Create a Tree Map object of size 300 x 300 pixels
c = TreeMapChart(300, 300)
c.setPlotArea(20, 20, 260, 260)
# Obtain the root of the tree map, which is the entire plot area
root = c.getRootNode()
# Add first level nodes to the root.
root.setData(data)
if chartIndex == 0 :
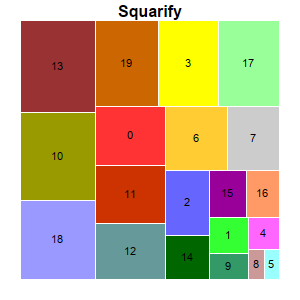
# Squarity - Layout the cells so that they are as square as possible.
c.addTitle("Squarify")
root.setLayoutMethod(TreeMapSquarify)
elif chartIndex == 1 :
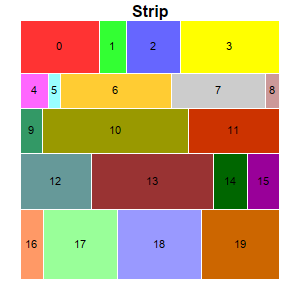
# Strip layout - Cells flow from left to right, top to bottom. The number of cells in each
# row is such that they will be as close to a square as possible. (The setLayoutMethod also
# supports other flow directions.)
c.addTitle("Strip")
root.setLayoutMethod(TreeMapStrip)
elif chartIndex == 2 :
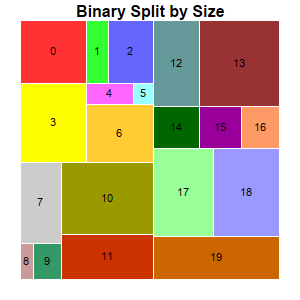
# Binary Split by Size - Split the cells into left/right groups so that their size are as
# close as possible. For each group, split the cells into top/bottom groups using the same
# criteria. Continue until each group contains one cell. (The setLayoutMethod also supports
# other flow directions.)
c.addTitle("Binary Split by Size")
root.setLayoutMethod(TreeMapBinaryBySize)
elif chartIndex == 3 :
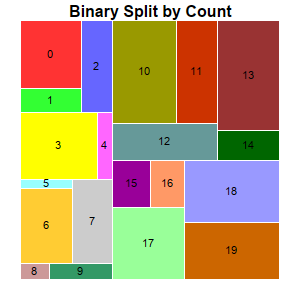
# Binary Split by Count - Same as "Binary Split by Size", except that the cell count
# (instead of the size) is used to split the cells.
c.addTitle("Binary Split by Count")
root.setLayoutMethod(TreeMapBinaryByCount)
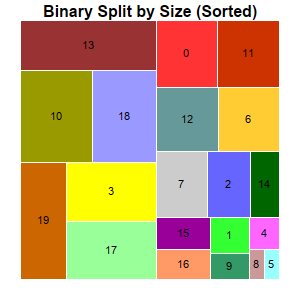
elif chartIndex == 4 :
# Binary Split by Size (Sorted) - Same as "Binary Split by Size" except the cells are sorted
# first.
c.addTitle("Binary Split by Size (Sorted)")
root.setSorting(-1)
root.setLayoutMethod(TreeMapBinaryBySize)
# Get the prototype (template) for the first level nodes.
nodeConfig = c.getLevelPrototype(1)
# Set the label format for the nodes to show the label and value with 8pt Arial Bold font in
# black color (000000) and center aligned in the node.
nodeConfig.setLabelFormat("{index}", "Arial", 8, 0x000000, Center)
# Set automatic fill color and white (ffffff) border
nodeConfig.setColors(DataColor, 0xffffff)
# Output the chart
c.makeChart("treemaplayout%s.png" % chartIndex)
createChart(0)
createChart(1)
createChart(2)
createChart(3)
createChart(4)