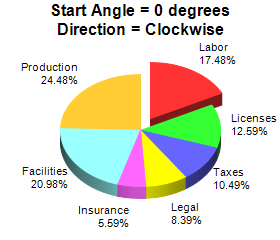
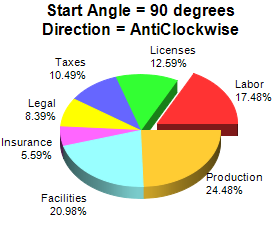
This example demonstrates different sector layout angles and directions.
By default, ChartDirector positions sectors starting from the upward pointing position, and in clockwise direction.
The start angle and layout direction can be changed using
PieChart.setStartAngle.
One common application for
PieChart.setStartAngle is to facilitate layout of pie charts containing many small sectors. Please refer to
Side Label Layout for an example.
[Ruby On Rails Version - Controller] app/controllers/anglepie_controller.rb
require("chartdirector")

class AnglepieController < ApplicationController

    def index()
        @title = "Start Angle and Direction"
        @ctrl_file = File.expand_path(__FILE__)
        @noOfCharts = 2
        render :template => "templates/chartview"
    end

    #
    # Render and deliver the chart
    #
    def getchart()
        # This script can draw different charts depending on the chartIndex
        chartIndex = (params["img"]).to_i

        # The data for the pie chart
        data = [25, 18, 15, 12, 8, 30, 35]

        # The labels for the pie chart
        labels = ["Labor", "Licenses", "Taxes", "Legal", "Insurance", "Facilities", "Production"]

        # Create a PieChart object of size 280 x 240 pixels
        c = ChartDirector::PieChart.new(280, 240)

        # Set the center of the pie at (140, 130) and the radius to 80 pixels
        c.setPieSize(140, 130, 80)

        # Add a title to the pie to show the start angle and direction
        if chartIndex == 0
            c.addTitle("Start Angle = 0 degrees\nDirection = Clockwise")
        else
            c.addTitle("Start Angle = 90 degrees\nDirection = AntiClockwise")
            c.setStartAngle(90, false)
        end

        # Draw the pie in 3D
        c.set3D()

        # Set the pie data and the pie labels
        c.setData(data, labels)

        # Explode the 1st sector (index = 0)
        c.setExplode(0)

        # Output the chart
        send_data(c.makeChart2(ChartDirector::PNG), :type => "image/png", :disposition => "inline")

    end

end |
[Ruby On Rails Version - View] app/views/templates/chartview.html.erb
<html>
<body style="margin:5px 0px 0px 5px">

<!-- Title -->
<div style="font-size:18pt; font-family:verdana; font-weight:bold">
    <%= @title %>
</div>
<hr style="border:solid 1px #000080" />

<!-- Source Code Listing Link -->
<div style="font-size:9pt; font-family:verdana; margin-bottom:1.5em">
    <%= link_to "Source Code Listing",
        :controller => "cddemo", :action => "viewsource",
        :ctrl_file => @ctrl_file, :view_file => File.expand_path(__FILE__) %>
</div>

<!-- Create one or more IMG tags to display the demo chart(s) -->
<% 0.upto(@noOfCharts - 1) do |i| %>
    <img src="<%= url_for(:action => "getchart", :img => i) %>">
<% end %>

</body>
</html> |
[Command Line Version] rubydemo/anglepie.rb
#!/usr/bin/env ruby
require("chartdirector")

def createChart(chartIndex)

    # The data for the pie chart
    data = [25, 18, 15, 12, 8, 30, 35]

    # The labels for the pie chart
    labels = ["Labor", "Licenses", "Taxes", "Legal", "Insurance", "Facilities", "Production"]

    # Create a PieChart object of size 280 x 240 pixels
    c = ChartDirector::PieChart.new(280, 240)

    # Set the center of the pie at (140, 130) and the radius to 80 pixels
    c.setPieSize(140, 130, 80)

    # Add a title to the pie to show the start angle and direction
    if chartIndex == 0
        c.addTitle("Start Angle = 0 degrees\nDirection = Clockwise")
    else
        c.addTitle("Start Angle = 90 degrees\nDirection = AntiClockwise")
        c.setStartAngle(90, false)
    end

    # Draw the pie in 3D
    c.set3D()

    # Set the pie data and the pie labels
    c.setData(data, labels)

    # Explode the 1st sector (index = 0)
    c.setExplode(0)

    # Output the chart
    c.makeChart("anglepie%s.png" % chartIndex)
end

createChart(0)
createChart(1) |
© 2017 Advanced Software Engineering Limited. All rights reserved.