ChartDirector 6.0 (Ruby Edition)

Candlestick Chart


This example demonstrates a candlestick chart.

Source Code Listing

[Ruby On Rails Version - Controller] app/controllers/candlestick_controller.rb
require("chartdirector")

class CandlestickController < ApplicationController

    def index()
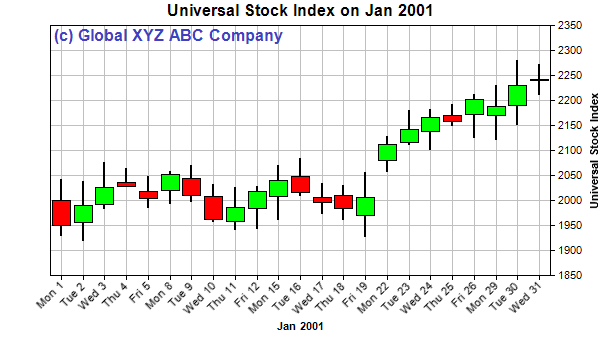
        @title = "Simple Candlestick Chart"
        @ctrl_file = File.expand_path(__FILE__)
        @noOfCharts = 1
        render :template => "templates/chartview"
    end

    #
    # Render and deliver the chart
    #
    def getchart()
        #
        # Sample data for the CandleStick chart.
        #
        highData = [2043, 2039, 2076, 2064, 2048, 2058, 2070, 2033, 2027, 2029, 2071, 2085, 2034,
            2031, 2056, 2128, 2180, 2183, 2192, 2213, 2230, 2281, 2272]

        lowData = [1931, 1921, 1985, 2028, 1986, 1994, 1999, 1958, 1943, 1944, 1962, 2011, 1975,
            1962, 1928, 2059, 2112, 2103, 2151, 2127, 2123, 2152, 2212]

        openData = [2000, 1957, 1993, 2037, 2018, 2021, 2045, 2009, 1959, 1985, 2008, 2048, 2006,
            2010, 1971, 2080, 2116, 2137, 2170, 2172, 2171, 2191, 2240]

        closeData = [1950, 1991, 2026, 2029, 2004, 2053, 2011, 1962, 1987, 2019, 2040, 2016, 1996,
            1985, 2006, 2113, 2142, 2167, 2158, 2201, 2188, 2231, 2242]

        # The labels for the CandleStick chart
        labels = ["Mon 1", "Tue 2", "Wed 3", "Thu 4", "Fri 5", "Mon 8", "Tue 9", "Wed 10", "Thu 11",
            "Fri 12", "Mon 15", "Tue 16", "Wed 17", "Thu 18", "Fri 19", "Mon 22", "Tue 23",
            "Wed 24", "Thu 25", "Fri 26", "Mon 29", "Tue 30", "Wed 31"]

        # Create a XYChart object of size 600 x 350 pixels
        c = ChartDirector::XYChart.new(600, 350)

        # Set the plotarea at (50, 25) and of size 500 x 250 pixels. Enable both the horizontal and
        # vertical grids by setting their colors to grey (0xc0c0c0)
        c.setPlotArea(50, 25, 500, 250).setGridColor(0xc0c0c0, 0xc0c0c0)

        # Add a title to the chart
        c.addTitle("Universal Stock Index on Jan 2001")

        # Add a custom text at (50, 25) (the upper left corner of the plotarea). Use 12pt Arial
        # Bold/blue (4040c0) as the font.
        c.addText(50, 25, "(c) Global XYZ ABC Company", "arialbd.ttf", 12, 0x4040c0)

        # Add a title to the x axis
        c.xAxis().setTitle("Jan 2001")

        # Set the labels on the x axis. Rotate the labels by 45 degrees.
        c.xAxis().setLabels(labels).setFontAngle(45)

        # Add a title to the y axis
        c.yAxis().setTitle("Universal Stock Index")

        # Draw the y axis on the right hand side of the plot area
        c.setYAxisOnRight(true)

        # Add a CandleStick layer to the chart using green (00ff00) for up candles and red (ff0000)
        # for down candles
        layer = c.addCandleStickLayer(highData, lowData, openData, closeData, 0x00ff00, 0xff0000)

        # Set the line width to 2 pixels
        layer.setLineWidth(2)

        # Output the chart
        send_data(c.makeChart2(ChartDirector::PNG), :type => "image/png", :disposition => "inline")

    end

end

[Ruby On Rails Version - View] app/views/templates/chartview.html.erb
<html>
<body style="margin:5px 0px 0px 5px">

<!-- Title -->
<div style="font-size:18pt; font-family:verdana; font-weight:bold">
    <%= @title %>
</div>
<hr style="border:solid 1px #000080" />

<!-- Source Code Listing Link -->
<div style="font-size:9pt; font-family:verdana; margin-bottom:1.5em">
    <%= link_to "Source Code Listing", 
        :controller => "cddemo", :action => "viewsource",
        :ctrl_file => @ctrl_file, :view_file => File.expand_path(__FILE__) %>
</div>

<!-- Create one or more IMG tags to display the demo chart(s) -->
<% 0.upto(@noOfCharts - 1) do |i| %>
    <img src="<%= url_for(:action => "getchart", :img => i) %>">
<% end %>

</body>
</html>

[Command Line Version] rubydemo/candlestick.rb
#!/usr/bin/env ruby
require("chartdirector")

#
# Sample data for the CandleStick chart.
#
highData = [2043, 2039, 2076, 2064, 2048, 2058, 2070, 2033, 2027, 2029, 2071, 2085, 2034, 2031,
    2056, 2128, 2180, 2183, 2192, 2213, 2230, 2281, 2272]

lowData = [1931, 1921, 1985, 2028, 1986, 1994, 1999, 1958, 1943, 1944, 1962, 2011, 1975, 1962, 1928,
    2059, 2112, 2103, 2151, 2127, 2123, 2152, 2212]

openData = [2000, 1957, 1993, 2037, 2018, 2021, 2045, 2009, 1959, 1985, 2008, 2048, 2006, 2010,
    1971, 2080, 2116, 2137, 2170, 2172, 2171, 2191, 2240]

closeData = [1950, 1991, 2026, 2029, 2004, 2053, 2011, 1962, 1987, 2019, 2040, 2016, 1996, 1985,
    2006, 2113, 2142, 2167, 2158, 2201, 2188, 2231, 2242]

# The labels for the CandleStick chart
labels = ["Mon 1", "Tue 2", "Wed 3", "Thu 4", "Fri 5", "Mon 8", "Tue 9", "Wed 10", "Thu 11",
    "Fri 12", "Mon 15", "Tue 16", "Wed 17", "Thu 18", "Fri 19", "Mon 22", "Tue 23", "Wed 24",
    "Thu 25", "Fri 26", "Mon 29", "Tue 30", "Wed 31"]

# Create a XYChart object of size 600 x 350 pixels
c = ChartDirector::XYChart.new(600, 350)

# Set the plotarea at (50, 25) and of size 500 x 250 pixels. Enable both the horizontal and vertical
# grids by setting their colors to grey (0xc0c0c0)
c.setPlotArea(50, 25, 500, 250).setGridColor(0xc0c0c0, 0xc0c0c0)

# Add a title to the chart
c.addTitle("Universal Stock Index on Jan 2001")

# Add a custom text at (50, 25) (the upper left corner of the plotarea). Use 12pt Arial Bold/blue
# (4040c0) as the font.
c.addText(50, 25, "(c) Global XYZ ABC Company", "arialbd.ttf", 12, 0x4040c0)

# Add a title to the x axis
c.xAxis().setTitle("Jan 2001")

# Set the labels on the x axis. Rotate the labels by 45 degrees.
c.xAxis().setLabels(labels).setFontAngle(45)

# Add a title to the y axis
c.yAxis().setTitle("Universal Stock Index")

# Draw the y axis on the right hand side of the plot area
c.setYAxisOnRight(true)

# Add a CandleStick layer to the chart using green (00ff00) for up candles and red (ff0000) for down
# candles
layer = c.addCandleStickLayer(highData, lowData, openData, closeData, 0x00ff00, 0xff0000)

# Set the line width to 2 pixels
layer.setLineWidth(2)

# Output the chart
c.makeChart("candlestick.png")