require("chartdirector")
class ConcentricController < ApplicationController
def index()
@title = "Concentric Donut Chart"
@ctrl_file = File.expand_path(__FILE__)
@noOfCharts = 1
render :template => "templates/chartview"
end
#
# Render and deliver the chart
#
def getchart()
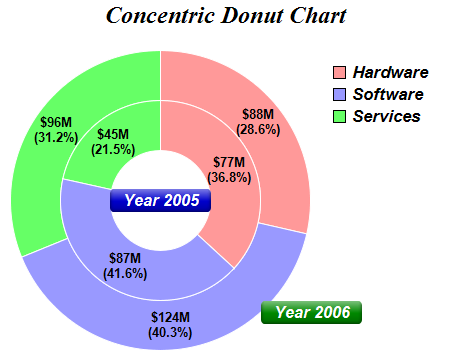
# Data for outer ring
data = [88, 124, 96]
# Data for inner ring
data2 = [77, 87, 45]
# Labels for the sectors
labels = ["Hardware", "Software", "Services"]
# Colors for the sectors
colors = [0xff9999, 0x9999ff, 0x66ff66]
#
# Create the main chart, which contains the chart title, the outer ring, and the legend box
#
# Create a PieChart object of size 450 x 360 pixels, with transparent background
c = ChartDirector::PieChart.new(450, 360)
# Add a title to the chart with 18pt Times Bold Italic font
c.addTitle("Concentric Donut Chart", "timesbi.ttf", 18)
# Set donut center at (160, 200), and outer/inner radii as 150/100 pixels
c.setDonutSize(160, 200, 150, 100)
# Add a label at the bottom-right corner of the ring to label the outer ring Use 12pt Arial
# Bold Italic font in white (ffffff) color, on a green (008800) background, with soft
# lighting effect and 5 pixels rounded corners
t = c.addText(260, 300, " Year 2006 ", "arialbi.ttf", 12, 0xffffff)
t.setBackground(0x008800, ChartDirector::Transparent, ChartDirector::softLighting())
t.setRoundedCorners(5)
# Set the legend box at (320, 50) with 12pt Arial Bold Italic font, with no border
c.addLegend(320, 50, true, "arialbi.ttf", 13).setBackground(ChartDirector::Transparent,
ChartDirector::Transparent)
# Set the pie data and the pie labels
c.setData(data, labels)
# Set the pie colors
c.setColors2(ChartDirector::DataColor, colors)
# Set pie border color to white (ffffff)
c.setLineColor(0xffffff)
# Set pie label to value in $###M format, percentage in (##.#%) format, in two lines.
c.setLabelFormat("${value}M<*br*>({percent|1}%)")
# Use 10pt Airal Bold for the sector labels
c.setLabelStyle("arialbd.ttf", 10)
# Set the label position to -25 pixels from the sector (which would be internal to the
# sector)
c.setLabelPos(-25)
#
# Create the inner ring.
#
# Create a PieChart object of size 280 x 320 pixels, with transparent background
c2 = ChartDirector::PieChart.new(280, 320, ChartDirector::Transparent)
# Set donut center at (110, 110), and outer/inner radii as 100/50 pixels
c2.setDonutSize(110, 110, 100, 50)
# Add a label at the center of the ring to label the inner ring. Use 12pt Arial Bold Italic
# font in white (ffffff) color, on a deep blue (0000cc) background, with soft lighting
# effect and 5 pixels rounded corners
t2 = c2.addText(110, 110, " Year 2005 ", "arialbi.ttf", 12, 0xffffff, ChartDirector::Center)
t2.setBackground(0x0000cc, ChartDirector::Transparent, ChartDirector::softLighting())
t2.setRoundedCorners(5)
# Set the pie data and the pie labels
c2.setData(data2, labels)
# Set the pie colors
c2.setColors2(ChartDirector::DataColor, colors)
# Set pie border color to white (ffffff)
c2.setLineColor(0xffffff)
# Set pie label to value in $###M format, percentage in (##.#%) format, in two lines.
c2.setLabelFormat("${value}M<*br*>({percent|1}%)")
# Use 10pt Airal Bold for the sector labels
c2.setLabelStyle("arialbd.ttf", 10)
# Set the label position to -25 pixels from the sector (which would be internal to the
# sector)
c2.setLabelPos(-25)
# merge the inner ring into the outer ring at (50, 90)
c.makeChart3().merge(c2.makeChart3(), 50, 90, ChartDirector::TopLeft, 0)
# Output the chart
send_data(c.makeChart2(ChartDirector::PNG), :type => "image/png", :disposition => "inline")
end
end |