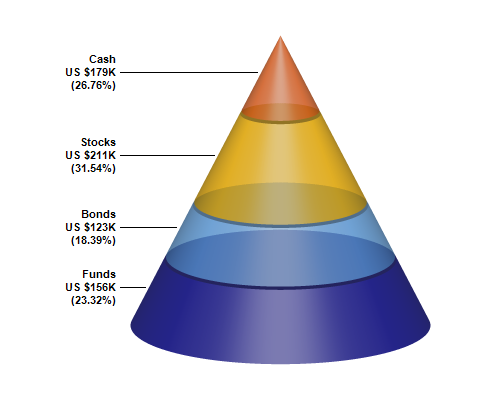
This example demonstrates using PyramidChart.setConeSize to specify using a cone instead of a pyramid to represent the data.
ChartDirector 6.0 (Ruby Edition)
Cone Chart
Source Code Listing
require("chartdirector")

class ConeController < ApplicationController

    def index()
        @title = "Cone Chart"
        @ctrl_file = File.expand_path(__FILE__)
        @noOfCharts = 1
        render :template => "templates/chartview"
    end

    #
    # Render and deliver the chart
    #
    def getchart()
        # The data for the pyramid chart
        data = [156, 123, 211, 179]

        # The labels for the pyramid chart
        labels = ["Funds", "Bonds", "Stocks", "Cash"]

        # The semi-transparent colors for the pyramid layers
        colors = [0x60000088, 0x6066aaee, 0x60ffbb00, 0x60ee6622]

        # Create a PyramidChart object of size 480 x 400 pixels
        c = ChartDirector::PyramidChart.new(480, 400)

        # Set the cone center at (280, 180), and width x height to 150 x 300 pixels
        c.setConeSize(280, 180, 150, 300)

        # Set the elevation to 15 degrees
        c.setViewAngle(15)

        # Set the pyramid data and labels
        c.setData(data, labels)

        # Set the layer colors to the given colors
        c.setColors2(ChartDirector::DataColor, colors)

        # Leave 1% gaps between layers
        c.setLayerGap(0.01)

        # Add labels at the left side of the pyramid layers using Arial Bold font. The labels will
        # have 3 lines showing the layer name, value and percentage.
        c.setLeftLabel("{label}\nUS ${value}K\n({percent}%)", "arialbd.ttf")

        # Output the chart
        send_data(c.makeChart2(ChartDirector::PNG), :type => "image/png", :disposition => "inline")

    end

end |
<html>
<body style="margin:5px 0px 0px 5px">

<!-- Title -->
<div style="font-size:18pt; font-family:verdana; font-weight:bold">
    <%= @title %>
</div>
<hr style="border:solid 1px #000080" />

<!-- Source Code Listing Link -->
<div style="font-size:9pt; font-family:verdana; margin-bottom:1.5em">
    <%= link_to "Source Code Listing",
        :controller => "cddemo", :action => "viewsource",
        :ctrl_file => @ctrl_file, :view_file => File.expand_path(__FILE__) %>
</div>

<!-- Create one or more IMG tags to display the demo chart(s) -->
<% 0.upto(@noOfCharts - 1) do |i| %>
    <img src="<%= url_for(:action => "getchart", :img => i) %>">
<% end %>

</body>
</html> |
#!/usr/bin/env ruby
require("chartdirector")

# The data for the pyramid chart
data = [156, 123, 211, 179]

# The labels for the pyramid chart
labels = ["Funds", "Bonds", "Stocks", "Cash"]

# The semi-transparent colors for the pyramid layers
colors = [0x60000088, 0x6066aaee, 0x60ffbb00, 0x60ee6622]

# Create a PyramidChart object of size 480 x 400 pixels
c = ChartDirector::PyramidChart.new(480, 400)

# Set the cone center at (280, 180), and width x height to 150 x 300 pixels
c.setConeSize(280, 180, 150, 300)

# Set the elevation to 15 degrees
c.setViewAngle(15)

# Set the pyramid data and labels
c.setData(data, labels)

# Set the layer colors to the given colors
c.setColors2(ChartDirector::DataColor, colors)

# Leave 1% gaps between layers
c.setLayerGap(0.01)

# Add labels at the left side of the pyramid layers using Arial Bold font. The labels will have 3
# lines showing the layer name, value and percentage.
c.setLeftLabel("{label}\nUS ${value}K\n({percent}%)", "arialbd.ttf")

# Output the chart
c.makeChart("cone.png") |