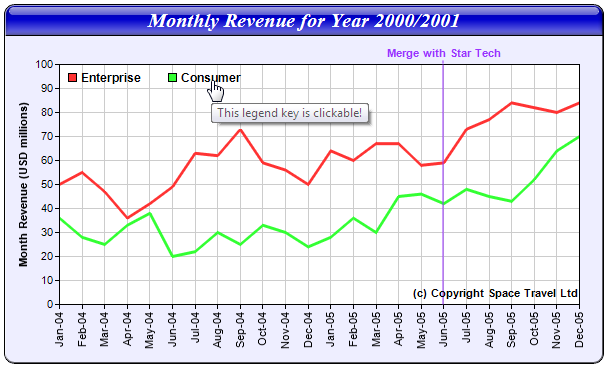
In this example, a clickable line chart will be created with legend keys, a title box, a vertical mark with label, and a custom text box. All these objects will be clickable in addition to the lines and the data points.
This example also demonstrate how to use client side Javascript as the click handler.
The code for this example is listed below.
[Ruby On Rails Version - Controller] app/controllers/customclick_controller.rb
require("chartdirector")

class CustomclickController < ApplicationController
    include ChartDirector::InteractiveChartSupport

    def index()
        @ctrl_file = File.expand_path(__FILE__)

        # The data for the line chart
        data0 = [50, 55, 47, 36, 42, 49, 63, 62, 73, 59, 56, 50, 64, 60, 67, 67, 58, 59, 73, 77, 84,
            82, 80, 84]
        data1 = [36, 28, 25, 33, 38, 20, 22, 30, 25, 33, 30, 24, 28, 36, 30, 45, 46, 42, 48, 45, 43,
            52, 64, 70]

        # The labels for the line chart
        labels = ["Jan-04", "Feb-04", "Mar-04", "Apr-04", "May-04", "Jun-04", "Jul-04", "Aug-04",
            "Sep-04", "Oct-04", "Nov-04", "Dec-04", "Jan-05", "Feb-05", "Mar-05", "Apr-05",
            "May-05", "Jun-05", "Jul-05", "Aug-05", "Sep-05", "Oct-05", "Nov-05", "Dec-05"]

        # Create an XYChart object of size 600 x 360 pixels, with a light blue (EEEEFF) background,
        # black border, 1 pxiel 3D border effect and rounded corners
        c = ChartDirector::XYChart.new(600, 360, 0xeeeeff, 0x000000, 1)
        c.setRoundedFrame()

        # Set plotarea at (55, 60) with size of 520 x 240 pixels. Use white (ffffff) as background
        # and grey (cccccc) for grid lines
        c.setPlotArea(55, 60, 520, 240, 0xffffff, -1, -1, 0xcccccc, 0xcccccc)

        # Add a legend box at (55, 58) (top of plot area) using 9pt Arial Bold font with horizontal
        # layout Set border and background colors of the legend box to Transparent
        legendBox = c.addLegend(55, 58, false, "arialbd.ttf", 9)
        legendBox.setBackground(ChartDirector::Transparent)

        # Reserve 10% margin at the top of the plot area during auto-scaling to leave space for the
        # legends.
        c.yAxis().setAutoScale(0.1)

        # Add a title to the chart using 15pt Times Bold Italic font. The text is white (ffffff) on
        # a blue (0000cc) background, with glass effect.
        title = c.addTitle("Monthly Revenue for Year 2000/2001", "timesbi.ttf", 15, 0xffffff)
        title.setBackground(0x0000cc, 0x000000, ChartDirector::glassEffect(
            ChartDirector::ReducedGlare))

        # Add a title to the y axis
        c.yAxis().setTitle("Month Revenue (USD millions)")

        # Set the labels on the x axis. Draw the labels vertical (angle = 90)
        c.xAxis().setLabels(labels).setFontAngle(90)

        # Add a vertical mark at x = 17 using a semi-transparent purple (809933ff) color and Arial
        # Bold font. Attached the mark (and therefore its label) to the top x axis.
        mark = c.xAxis2().addMark(17, 0x809933ff, "Merge with Star Tech", "arialbd.ttf")

        # Set the mark line width to 2 pixels
        mark.setLineWidth(2)

        # Set the mark label font color to purple (0x9933ff)
        mark.setFontColor(0x9933ff)

        # Add a copyright message at (575, 295) (bottom right of plot area) using Arial Bold font
        copyRight = c.addText(575, 295, "(c) Copyright Space Travel Ltd", "arialbd.ttf")
        copyRight.setAlignment(ChartDirector::BottomRight)

        # Add a line layer to the chart
        layer = c.addLineLayer()

        # Set the default line width to 3 pixels
        layer.setLineWidth(3)

        # Add the data sets to the line layer
        layer.addDataSet(data0, -1, "Enterprise")
        layer.addDataSet(data1, -1, "Consumer")

        # Create the image
        session["chart1"] = c.makeChart2(ChartDirector::PNG)

        # Create an image map for the chart
        chartImageMap = c.getHTMLImageMap(url_for(:controller => "xystub"), "",
            "title='{dataSetName} @ {xLabel} = USD {value|0} millions'")

        # Create an image map for the legend box
        legendImageMap = legendBox.getHTMLImageMap(
            "javascript:popMsg('the legend key [{dataSetName}]');", " ",
            "title='This legend key is clickable!'")

        # Obtain the image map for the title
        titleImageMap = "<area " + title.getImageCoor(
            ) + " href='javascript:popMsg(\"the chart title\");' title='The title is clickable!'>"

        # Obtain the image map for the mark
        markImageMap = "<area " + mark.getImageCoor(
            ) + " href='javascript:popMsg(\"the Merge with Star Tech mark\");' title='The Merge with Star Tech text is clickable!'>"

        # Obtain the image map for the copyright message
        copyRightImageMap = "<area " + copyRight.getImageCoor(
            ) + " href='javascript:popMsg(\"the copyright message\");' title='The copyright text is clickable!'>"

        # Get the combined image map
        @imageMap =
            chartImageMap + legendImageMap + titleImageMap + markImageMap + copyRightImageMap
    end

end |
[Ruby On Rails Version - View] app/views/customclick/index.html.erb
<html>
<body style="margin:5px 0px 0px 5px">
<script type="text/javascript">
function popMsg(msg) {
    alert("You have clicked on " + msg + ".");
}
</script>
<div style="font-size:18pt; font-family:verdana; font-weight:bold">
    Custom Clickable Objects
</div>
<hr style="border:solid 1px #000080" />
<div style="font-size:10pt; font-family:verdana; margin-bottom:20px">
    <%= link_to "Source Code Listing",
        :controller => "cddemo", :action => "viewsource",
        :ctrl_file => @ctrl_file, :view_file => File.expand_path(__FILE__) %>
</div>
<div style="font-size:10pt; font-family:verdana; width:600px; margin-bottom:20px">
    In the following chart, the lines, legend keys, title, copyright, and the "Merge
    with Star Tech" text are all clickable!
</div>
<img src="<%= url_for(:action => 'get_session_data', :id => 'chart1',
    :nocache => rand) %>" border="0" usemap="#map1">
<map name="map1">
<%= raw(@imageMap) %>
</map>
</body>
</html> |
In the above code, the chart is created and saved in a session variable. An <IMG> tag is used in the view to retrieve the chart with the "get_session_data" action. The "get_session_data" action is implemented in the InteractiveChartSupport class that is included as a mixin in the controller.
The image map in this example consists of multiple parts. The part for the line chart is produced using BaseChart.getHTMLImageMap with the "xystub" controller as the handler:
# Create an image map for the chart
chartImageMap = c.getHTMLImageMap(url_for(:controller => "xystub"), "",
    "title='{dataSetName} @ {xLabel} = USD {value|0} millions'")
For demo purpose, the handler simple displays information on what is clicked. It's code is as follows.
[Ruby On Rails Version - Controller] app/controllers/xystub_controller.rb
class XystubController < ApplicationController
    def index()
        @ctrl_file = File.expand_path(__FILE__)
    end
end |
[Ruby On Rails Version - View] app/views/xystub/index.html.erb
<html>
<body style="margin:5px 0px 0px 5px">
<div style="font-size:18pt; font-family:verdana; font-weight:bold">
    Simple Clickable XY Chart Handler
</div>
<hr style="border:solid 1px #000080" />
<div style="font-size:10pt; font-family:verdana; margin-bottom:20px">
    <%= link_to "Source Code Listing",
        :controller => "cddemo", :action => "viewsource",
        :ctrl_file => @ctrl_file, :view_file => File.expand_path(__FILE__) %>
</div>
<div style="font-size:10pt; font-family:verdana;">
<b>You have clicked on the following chart element :</b><br />
<ul>
    <li>Data Set : <%= params["dataSetName"] %></li>
    <li>X Position : <%= params["x"] %></li>
    <li>X Label : <%= params["xLabel"] %></li>
    <li>Data Value : <%= params["value"] %></li>
</ul>
</div>
</body>
</html> |
The image map for the legend keys is produced using LegendBox.getHTMLImageMap. In this example, client side Javascript will be executed when the user clicks on the legend key.
legendImageMap = legendBox.getHTMLImageMap(
    "javascript:popMsg('the legend key [{dataSetName}]');", " ",
    "title='This legend key is clickable!'")
As shown above, the "javascript:popMsg(...);" as used in the url parameter of "getHTMLImageMap". The browser will interpret it as a client side Javascript statement to be executed when the <AREA> tag is clicked.
Note that the second argument to LegendBox.getHTMLImageMap is set to a space character. This argument specifies the HTTP query parameters to be appended to the url. In this example, as the url is actually client side Javascript, no query parameter is necessary. So a space character is used. (We cannot use an empty string, as it means default query parameters, not no query parameter.)
The client side Javascript executed in this example just pops up a message.
<script type="text/javascript">
function popMsg(msg) {
    alert("You have clicked on " + msg + ".");
}
</script>
Most text messages in ChartDirector are represented as TextBox objects. Their image map coordinates can be retrieved using Box.getImageCoor. This allows <AREA> tags for TextBox objects be constructed easily. This example illustrates how to use this method to create image maps for the chart title, mark label, and the copyright message.
# Obtain the image map for the title
titleImageMap = "<area " + title.getImageCoor(
    ) + " href='javascript:popMsg(\"the chart title\");' title='The title is clickable!'>"

# Obtain the image map for the mark
markImageMap = "<area " + mark.getImageCoor(
    ) + " href='javascript:popMsg(\"the Merge with Star Tech mark\");' title='The Merge with Star Tech text is clickable!'>"

# Obtain the image map for the copyright message
copyRightImageMap = "<area " + copyRight.getImageCoor(
    ) + " href='javascript:popMsg(\"the copyright message\");' title='The copyright text is clickable!'>"
All the image map strings are simply appended together to form the combined image map for the chart.
@imageMap =
    chartImageMap + legendImageMap + titleImageMap + markImageMap + copyRightImageMap