require("chartdirector")
class IcondonutController < ApplicationController
def index()
@title = "Icon Donut Chart"
@ctrl_file = File.expand_path(__FILE__)
@noOfCharts = 1
render :template => "templates/chartview"
end
#
# Render and deliver the chart
#
def getchart()
# The data for the pie chart
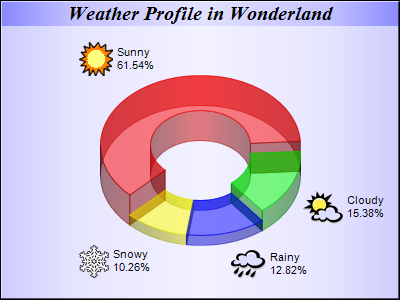
data = [72, 18, 15, 12]
# The depths for the sectors
depths = [30, 20, 10, 10]
# The labels for the pie chart
labels = ["Sunny", "Cloudy", "Rainy", "Snowy"]
# The icons for the sectors
icons = ["sun.png", "cloud.png", "rain.png", "snowy.png"]
# Create a PieChart object of size 400 x 300 pixels
c = ChartDirector::PieChart.new(400, 300)
# Use the semi-transparent palette for this chart
c.setColors(ChartDirector::transparentPalette)
# Set the background to metallic light blue (CCFFFF), with a black border and 1 pixel 3D
# border effect,
c.setBackground(ChartDirector::metalColor(0xccccff), 0x000000, 1)
# Set directory for loading images to current script directory
c.setSearchPath(File.dirname(__FILE__))
# Set donut center at (200, 175), and outer/inner radii as 100/50 pixels
c.setDonutSize(200, 175, 100, 50)
# Add a title box using 15pt Times Bold Italic font and metallic blue (8888FF) background
# color
c.addTitle("Weather Profile in Wonderland", "timesbi.ttf", 15).setBackground(
ChartDirector::metalColor(0x8888ff))
# Set the pie data and the pie labels
c.setData(data, labels)
# Add icons to the chart as a custom field
c.addExtraField(icons)
# Configure the sector labels using CDML to include the icon images
c.setLabelFormat(
"<*block,valign=absmiddle*><*img={field0}*> <*block*>{label}\n{percent}%<*/*><*/*>")
# Draw the pie in 3D with variable 3D depths
c.set3D2(depths)
# Set the start angle to 225 degrees may improve layout when the depths of the sector are
# sorted in descending order, because it ensures the tallest sector is at the back.
c.setStartAngle(225)
# Output the chart
send_data(c.makeChart2(ChartDirector::PNG), :type => "image/png", :disposition => "inline")
end
end |