ChartDirector 6.0 (Ruby Edition)

Line Comparison


This example demonstrates filling the area between two lines or curves, as well as a number of advanced chart formatting techniques.

ChartDirector supports filling the area between two lines. The lines can be from a LineLayer, SplineLayer, StepLineLayer, TrendLayer or from an axis Mark. Two colors can be used for filling, depending on which line is on top.

The effects in this example is achieved using the following methods:

Source Code Listing

[Ruby On Rails Version - Controller] app/controllers/linecompare_controller.rb
require("chartdirector")

class LinecompareController < ApplicationController

    def index()
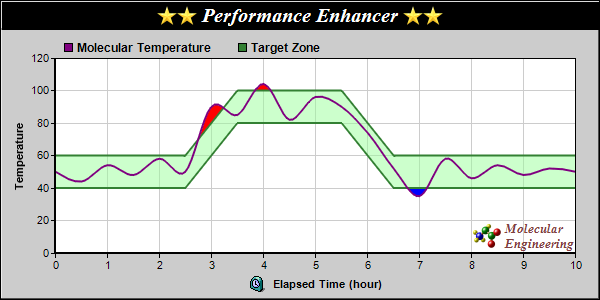
        @title = "Line with Target Zone"
        @ctrl_file = File.expand_path(__FILE__)
        @noOfCharts = 1
        render :template => "templates/chartview"
    end

    #
    # Render and deliver the chart
    #
    def getchart()
        # The data for the upper and lower bounding lines
        upperY = [60, 60, 100, 100, 60, 60]
        lowerY = [40, 40, 80, 80, 40, 40]
        zoneX = [0, 2.5, 3.5, 5.5, 6.5, 10]

        # The data for the spline curve
        curveY = [50, 44, 54, 48, 58, 50, 90, 85, 104, 82, 96, 90, 74, 52, 35, 58, 46, 54, 48, 52,
            50]
        curveX = [0, 0.5, 1, 1.5, 2, 2.5, 3, 3.5, 4, 4.5, 5, 5.5, 6, 6.5, 7, 7.5, 8, 8.5, 9, 9.5, 10
            ]

        # Create a XYChart object of size 600 x 300 pixels, with a light grey (cccccc) background,
        # black border, and 1 pixel 3D border effect.
        c = ChartDirector::XYChart.new(600, 300, 0xcccccc, 0x000000, 1)

        # Set directory for loading images to current script directory
        c.setSearchPath(File.dirname(__FILE__))

        # Set the plotarea at (55, 58) and of size 520 x 195 pixels, with white background. Turn on
        # both horizontal and vertical grid lines with light grey color (cccccc)
        c.setPlotArea(55, 58, 520, 195, 0xffffff, -1, -1, 0xcccccc, 0xcccccc)

        # Add a legend box at (55, 32) (top of the chart) with horizontal layout. Use 9pt Arial Bold
        # font. Set the background and border color to Transparent.
        c.addLegend(55, 32, false, "arialbd.ttf", 9).setBackground(ChartDirector::Transparent)

        # Add a title box to the chart using 15pt Times Bold Italic font. The title is in CDML and
        # includes embedded images for highlight. The text is white (ffffff) on a black background,
        # with a 1 pixel 3D border.
        c.addTitle(
            "<*block,valign=absmiddle*><*img=star.png*><*img=star.png*> Performance Enhancer " \
            "<*img=star.png*><*img=star.png*><*/*>", "timesbi.ttf", 15, 0xffffff).setBackground(
            0x000000, -1, 1)

        # Add a title to the y axis
        c.yAxis().setTitle("Temperature")

        # Add a title to the x axis using CMDL
        c.xAxis().setTitle("<*block,valign=absmiddle*><*img=clock.png*>  Elapsed Time (hour)<*/*>")

        # Set the axes width to 2 pixels
        c.xAxis().setWidth(2)
        c.yAxis().setWidth(2)

        # Add a purple (800080) spline layer to the chart with a line width of 2 pixels
        splineLayer = c.addSplineLayer(curveY, 0x800080, "Molecular Temperature")
        splineLayer.setXData(curveX)
        splineLayer.setLineWidth(2)

        # Add a line layer to the chart with two dark green (338033) data sets, and a line width of
        # 2 pixels
        lineLayer = c.addLineLayer2()
        lineLayer.addDataSet(upperY, 0x338033, "Target Zone")
        lineLayer.addDataSet(lowerY, 0x338033)
        lineLayer.setXData(zoneX)
        lineLayer.setLineWidth(2)

        # Color the zone between the upper zone line and lower zone line as semi-transparent light
        # green (8099ff99)
        c.addInterLineLayer(lineLayer.getLine(0), lineLayer.getLine(1), 0x8099ff99, 0x8099ff99)

        # If the spline line gets above the upper zone line, color to area between the lines red
        # (ff0000)
        c.addInterLineLayer(splineLayer.getLine(0), lineLayer.getLine(0), 0xff0000,
            ChartDirector::Transparent)

        # If the spline line gets below the lower zone line, color to area between the lines blue
        # (0000ff)
        c.addInterLineLayer(splineLayer.getLine(0), lineLayer.getLine(1),
            ChartDirector::Transparent, 0x0000ff)

        # Add a custom CDML text at the bottom right of the plot area as the logo
        c.addText(575, 250,
            "<*block,valign=absmiddle*><*img=small_molecule.png*> <*block*>" \
            "<*font=timesbi.ttf,size=10,color=804040*>Molecular\nEngineering<*/*>").setAlignment(
            ChartDirector::BottomRight)

        # Output the chart
        send_data(c.makeChart2(ChartDirector::PNG), :type => "image/png", :disposition => "inline")

    end

end

[Ruby On Rails Version - View] app/views/templates/chartview.html.erb
<html>
<body style="margin:5px 0px 0px 5px">

<!-- Title -->
<div style="font-size:18pt; font-family:verdana; font-weight:bold">
    <%= @title %>
</div>
<hr style="border:solid 1px #000080" />

<!-- Source Code Listing Link -->
<div style="font-size:9pt; font-family:verdana; margin-bottom:1.5em">
    <%= link_to "Source Code Listing", 
        :controller => "cddemo", :action => "viewsource",
        :ctrl_file => @ctrl_file, :view_file => File.expand_path(__FILE__) %>
</div>

<!-- Create one or more IMG tags to display the demo chart(s) -->
<% 0.upto(@noOfCharts - 1) do |i| %>
    <img src="<%= url_for(:action => "getchart", :img => i) %>">
<% end %>

</body>
</html>

[Command Line Version] rubydemo/linecompare.rb
#!/usr/bin/env ruby
require("chartdirector")

# The data for the upper and lower bounding lines
upperY = [60, 60, 100, 100, 60, 60]
lowerY = [40, 40, 80, 80, 40, 40]
zoneX = [0, 2.5, 3.5, 5.5, 6.5, 10]

# The data for the spline curve
curveY = [50, 44, 54, 48, 58, 50, 90, 85, 104, 82, 96, 90, 74, 52, 35, 58, 46, 54, 48, 52, 50]
curveX = [0, 0.5, 1, 1.5, 2, 2.5, 3, 3.5, 4, 4.5, 5, 5.5, 6, 6.5, 7, 7.5, 8, 8.5, 9, 9.5, 10]

# Create a XYChart object of size 600 x 300 pixels, with a light grey (cccccc) background, black
# border, and 1 pixel 3D border effect.
c = ChartDirector::XYChart.new(600, 300, 0xcccccc, 0x000000, 1)

# Set the plotarea at (55, 58) and of size 520 x 195 pixels, with white background. Turn on both
# horizontal and vertical grid lines with light grey color (cccccc)
c.setPlotArea(55, 58, 520, 195, 0xffffff, -1, -1, 0xcccccc, 0xcccccc)

# Add a legend box at (55, 32) (top of the chart) with horizontal layout. Use 9pt Arial Bold font.
# Set the background and border color to Transparent.
c.addLegend(55, 32, false, "arialbd.ttf", 9).setBackground(ChartDirector::Transparent)

# Add a title box to the chart using 15pt Times Bold Italic font. The title is in CDML and includes
# embedded images for highlight. The text is white (ffffff) on a black background, with a 1 pixel 3D
# border.
c.addTitle(
    "<*block,valign=absmiddle*><*img=star.png*><*img=star.png*> Performance Enhancer " \
    "<*img=star.png*><*img=star.png*><*/*>", "timesbi.ttf", 15, 0xffffff).setBackground(0x000000,
    -1, 1)

# Add a title to the y axis
c.yAxis().setTitle("Temperature")

# Add a title to the x axis using CMDL
c.xAxis().setTitle("<*block,valign=absmiddle*><*img=clock.png*>  Elapsed Time (hour)<*/*>")

# Set the axes width to 2 pixels
c.xAxis().setWidth(2)
c.yAxis().setWidth(2)

# Add a purple (800080) spline layer to the chart with a line width of 2 pixels
splineLayer = c.addSplineLayer(curveY, 0x800080, "Molecular Temperature")
splineLayer.setXData(curveX)
splineLayer.setLineWidth(2)

# Add a line layer to the chart with two dark green (338033) data sets, and a line width of 2 pixels
lineLayer = c.addLineLayer2()
lineLayer.addDataSet(upperY, 0x338033, "Target Zone")
lineLayer.addDataSet(lowerY, 0x338033)
lineLayer.setXData(zoneX)
lineLayer.setLineWidth(2)

# Color the zone between the upper zone line and lower zone line as semi-transparent light green
# (8099ff99)
c.addInterLineLayer(lineLayer.getLine(0), lineLayer.getLine(1), 0x8099ff99, 0x8099ff99)

# If the spline line gets above the upper zone line, color to area between the lines red (ff0000)
c.addInterLineLayer(splineLayer.getLine(0), lineLayer.getLine(0), 0xff0000,
    ChartDirector::Transparent)

# If the spline line gets below the lower zone line, color to area between the lines blue (0000ff)
c.addInterLineLayer(splineLayer.getLine(0), lineLayer.getLine(1), ChartDirector::Transparent,
    0x0000ff)

# Add a custom CDML text at the bottom right of the plot area as the logo
c.addText(575, 250,
    "<*block,valign=absmiddle*><*img=small_molecule.png*> <*block*>" \
    "<*font=timesbi.ttf,size=10,color=804040*>Molecular\nEngineering<*/*>").setAlignment(
    ChartDirector::BottomRight)

# Output the chart
c.makeChart("linecompare.png")