require("chartdirector")
class LinefillController < ApplicationController
def index()
@title = "Inter-Line Coloring"
@ctrl_file = File.expand_path(__FILE__)
@noOfCharts = 1
render :template => "templates/chartview"
end
#
# Render and deliver the chart
#
def getchart()
# The data for the line chart
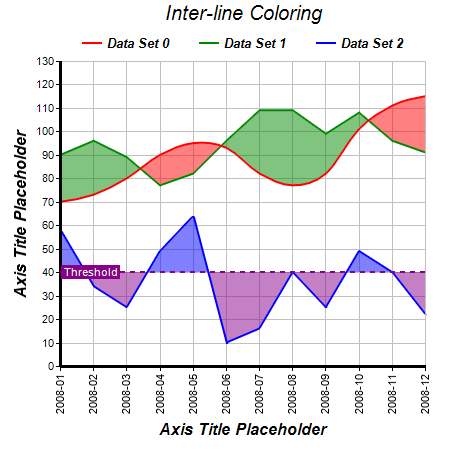
data0 = [70, 73, 80, 90, 95, 93, 82, 77, 82, 101, 111, 115]
data1 = [90, 96, 89, 77, 82, 96, 109, 109, 99, 108, 96, 91]
data2 = [58, 34, 25, 49, 64, 10, 16, 40, 25, 49, 40, 22]
# The labels for the line chart
labels = ["2008-01", "2008-02", "2008-03", "2008-04", "2008-05", "2008-06", "2008-07",
"2008-08", "2008-09", "2008-10", "2008-11", "2008-12"]
# Create a XYChart object of size 450 x 450 pixels
c = ChartDirector::XYChart.new(450, 450)
# Add a title to the chart using 15pt Arial Italic font.
title = c.addTitle("Inter-line Coloring", "ariali.ttf", 15)
# Add a legend box where the top-center is anchored to the horizontal center of the chart,
# just under the title. Use horizontal layout and 10 points Arial Bold font, and transparent
# background and border. Use line style legend key.
legendBox = c.addLegend(c.getWidth() / 2, title.getHeight(), false, "arialbi.ttf", 10)
legendBox.setBackground(ChartDirector::Transparent, ChartDirector::Transparent)
legendBox.setAlignment(ChartDirector::TopCenter)
legendBox.setLineStyleKey()
# Tentatively set the plotarea at (70, 65) and of (chart_width - 100) x (chart_height - 110)
# in size. Use light grey (c0c0c0) border and horizontal and vertical grid lines.
plotArea = c.setPlotArea(70, 65, c.getWidth() - 100, c.getHeight() - 110, -1, -1, 0xc0c0c0,
0xc0c0c0, -1)
# Add a title to the y axis using 12pt Arial Bold Italic font
c.yAxis().setTitle("Axis Title Placeholder", "arialbi.ttf", 12)
# Add a title to the x axis using 12pt Arial Bold Italic font
c.xAxis().setTitle("Axis Title Placeholder", "arialbi.ttf", 12)
# Set the axes line width to 3 pixels
c.xAxis().setWidth(3)
c.yAxis().setWidth(3)
# Set the labels on the x axis.
c.xAxis().setLabels(labels)
# Use 8 points Arial rotated by 90 degrees as the x-axis label font
c.xAxis().setLabelStyle("arial.ttf", 8, ChartDirector::TextColor, 90)
# Add a spline curve to the chart
layer0 = c.addSplineLayer(data0, 0xff0000, "Data Set 0")
layer0.setLineWidth(2)
# Add a normal line to the chart
layer1 = c.addLineLayer(data1, 0x008800, "Data Set 1")
layer1.setLineWidth(2)
# Color the region between the above spline curve and normal line. Use the semi-transparent
# red (80ff000000) if the spline curve is higher than the normal line, otherwise use
# semi-transparent green (80008800)
c.addInterLineLayer(layer0.getLine(), layer1.getLine(), 0x80ff0000, 0x80008800)
# Add another normal line to the chart
layer2 = c.addLineLayer(data2, 0x0000ff, "Data Set 2")
layer2.setLineWidth(2)
# Add a horizontal mark line to the chart at y = 40
mark = c.yAxis().addMark(40, -1, "Threshold")
mark.setLineWidth(2)
# Set the mark line to purple (880088) dash line. Use white (ffffff) for the mark label.
mark.setMarkColor(c.dashLineColor(0x880088), 0xffffff)
# Put the mark label at the left side of the mark, with a purple (880088) background.
mark.setAlignment(ChartDirector::Left)
mark.setBackground(0x880088)
# Color the region between the above normal line and mark line. Use the semi-transparent
# blue (800000ff) if the normal line is higher than the mark line, otherwise use
# semi-transparent purple (80880088)
c.addInterLineLayer(layer2.getLine(), mark.getLine(), 0x800000ff, 0x80880088)
# Layout the legend box, so we can get its height
c.layoutLegend()
# Adjust the plot area size, such that the bounding box (inclusive of axes) is 10 pixels
# from the left edge, just under the legend box, 25 pixels from the right edge, and 10
# pixels from the bottom edge.
c.packPlotArea(10, legendBox.getTopY() + legendBox.getHeight(), c.getWidth() - 25,
c.getHeight() - 10)
# After determining the exact plot area position, we may adjust the legend box and the title
# positions so that they are centered relative to the plot area (instead of the chart)
legendBox.setPos(plotArea.getLeftX() + (plotArea.getWidth() - legendBox.getWidth()) / 2,
legendBox.getTopY())
title.setPos(plotArea.getLeftX() + (plotArea.getWidth() - title.getWidth()) / 2,
title.getTopY())
# Output the chart
send_data(c.makeChart2(ChartDirector::PNG), :type => "image/png", :disposition => "inline")
end
end |