require("chartdirector")
class MarkbarController < ApplicationController
def index()
@title = "Bars with Marks"
@ctrl_file = File.expand_path(__FILE__)
@noOfCharts = 1
render :template => "templates/chartview"
end
#
# Render and deliver the chart
#
def getchart()
# The data for the bars and the marks
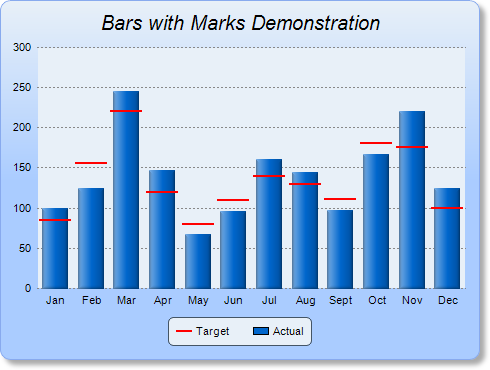
barData = [100, 125, 245, 147, 67, 96, 160, 145, 97, 167, 220, 125]
markData = [85, 156, 220, 120, 80, 110, 140, 130, 111, 180, 175, 100]
# The labels for the bar chart
labels = ["Jan", "Feb", "Mar", "Apr", "May", "Jun", "Jul", "Aug", "Sept", "Oct", "Nov",
"Dec"]
# Create a XYChart object of size 480 x 360 pixels. Use a vertical gradient color from pale
# blue (e8f0f8) to sky blue (aaccff) spanning half the chart height as background. Set
# border to blue (88aaee). Use rounded corners. Enable soft drop shadow.
c = ChartDirector::XYChart.new(480, 360)
c.setBackground(c.linearGradientColor(0, 0, 0, c.getHeight() / 2, 0xe8f0f8, 0xaaccff),
0x88aaee)
c.setRoundedFrame()
c.setDropShadow()
# Add a title to the chart using 15 points Arial Italic font. Set top/bottom margins to 12
# pixels.
title = c.addTitle("Bars with Marks Demonstration", "ariali.ttf", 15)
title.setMargin2(0, 0, 12, 12)
# Tentatively set the plotarea to 50 pixels from the left edge to allow for the y-axis, and
# to just under the title. Set the width to 65 pixels less than the chart width, and the
# height to reserve 90 pixels at the bottom for the x-axis and the legend box. Use pale blue
# (e8f0f8) background, transparent border, and grey (888888) dotted horizontal grid lines.
c.setPlotArea(50, title.getHeight(), c.getWidth() - 65, c.getHeight() - title.getHeight(
) - 90, 0xe8f0f8, -1, ChartDirector::Transparent, c.dashLineColor(0x888888,
ChartDirector::DotLine))
# Add a legend box where the bottom-center is anchored to the 15 pixels above the
# bottom-center of the chart. Use horizontal layout and 8 points Arial font.
legendBox = c.addLegend(c.getWidth() / 2, c.getHeight() - 15, false, "arial.ttf", 8)
legendBox.setAlignment(ChartDirector::BottomCenter)
# Set the legend box background and border to pale blue (e8f0f8) and bluish grey (445566)
legendBox.setBackground(0xe8f0f8, 0x445566)
# Use rounded corners of 5 pixel radius for the legend box
legendBox.setRoundedCorners(5)
# Use line style legend key
legendBox.setLineStyleKey()
# Set axes to transparent
c.xAxis().setColors(ChartDirector::Transparent)
c.yAxis().setColors(ChartDirector::Transparent)
# Set the labels on the x axis
c.xAxis().setLabels(labels)
# Add a box-whisker layer with just the middle mark visible for the marks. Use red (ff0000)
# color for the mark, with a line width of 2 pixels and 10% horizontal gap
markLayer = c.addBoxWhiskerLayer(nil, nil, nil, nil, markData, -1, 0xff0000)
markLayer.setLineWidth(2)
markLayer.setDataGap(0.1)
# Add the legend key for the mark line
legendBox.addKey("Target", 0xff0000, 2)
# Add a blue (0066cc) bar layer using the given data.
barLayer = c.addBarLayer(barData, 0x0066cc, "Actual")
# Use soft lighting effect for the bars with light direction from left.
barLayer.setBorderColor(ChartDirector::Transparent, ChartDirector::softLighting(
ChartDirector::Left))
# Adjust the plot area size, such that the bounding box (inclusive of axes) is 10 pixels
# from the left edge, just below the title, 15 pixels from the right edge, and 10 pixels
# above the legend box.
c.packPlotArea(10, title.getHeight(), c.getWidth() - 15, c.layoutLegend().getTopY() - 10)
# Output the chart
send_data(c.makeChart2(ChartDirector::PNG), :type => "image/png", :disposition => "inline")
end
end |