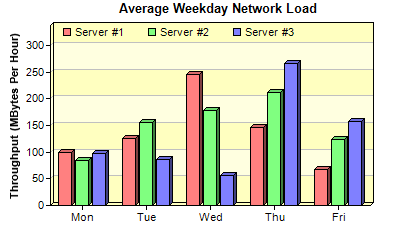
ChartDirector 6.0 (Ruby Edition)
Multi-Bar Chart
Source Code Listing
require("chartdirector") class MultibarController < ApplicationController def index() @title = "Multi-Bar Chart" @ctrl_file = File.expand_path(__FILE__) @noOfCharts = 1 render :template => "templates/chartview" end # # Render and deliver the chart # def getchart() # The data for the bar chart data0 = [100, 125, 245, 147, 67] data1 = [85, 156, 179, 211, 123] data2 = [97, 87, 56, 267, 157] labels = ["Mon", "Tue", "Wed", "Thu", "Fri"] # Create a XYChart object of size 400 x 240 pixels c = ChartDirector::XYChart.new(400, 240) # Add a title to the chart using 10 pt Arial font c.addTitle(" Average Weekday Network Load", "", 10) # Set the plot area at (50, 25) and of size 320 x 180. Use two alternative background colors # (0xffffc0 and 0xffffe0) c.setPlotArea(50, 25, 320, 180, 0xffffc0, 0xffffe0) # Add a legend box at (55, 18) using horizontal layout. Use 8 pt Arial font, with # transparent background c.addLegend(55, 18, false, "", 8).setBackground(ChartDirector::Transparent) # Add a title to the y-axis c.yAxis().setTitle("Throughput (MBytes Per Hour)") # Reserve 20 pixels at the top of the y-axis for the legend box c.yAxis().setTopMargin(20) # Set the x axis labels c.xAxis().setLabels(labels) # Add a multi-bar layer with 3 data sets and 3 pixels 3D depth layer = c.addBarLayer2(ChartDirector::Side, 3) layer.addDataSet(data0, 0xff8080, "Server #1") layer.addDataSet(data1, 0x80ff80, "Server #2") layer.addDataSet(data2, 0x8080ff, "Server #3") # Output the chart send_data(c.makeChart2(ChartDirector::PNG), :type => "image/png", :disposition => "inline") end end |
<html> <body style="margin:5px 0px 0px 5px"> <!-- Title --> <div style="font-size:18pt; font-family:verdana; font-weight:bold"> <%= @title %> </div> <hr style="border:solid 1px #000080" /> <!-- Source Code Listing Link --> <div style="font-size:9pt; font-family:verdana; margin-bottom:1.5em"> <%= link_to "Source Code Listing", :controller => "cddemo", :action => "viewsource", :ctrl_file => @ctrl_file, :view_file => File.expand_path(__FILE__) %> </div> <!-- Create one or more IMG tags to display the demo chart(s) --> <% 0.upto(@noOfCharts - 1) do |i| %> <img src="<%= url_for(:action => "getchart", :img => i) %>"> <% end %> </body> </html> |
#!/usr/bin/env ruby require("chartdirector") # The data for the bar chart data0 = [100, 125, 245, 147, 67] data1 = [85, 156, 179, 211, 123] data2 = [97, 87, 56, 267, 157] labels = ["Mon", "Tue", "Wed", "Thu", "Fri"] # Create a XYChart object of size 400 x 240 pixels c = ChartDirector::XYChart.new(400, 240) # Add a title to the chart using 10 pt Arial font c.addTitle(" Average Weekday Network Load", "", 10) # Set the plot area at (50, 25) and of size 320 x 180. Use two alternative background colors # (0xffffc0 and 0xffffe0) c.setPlotArea(50, 25, 320, 180, 0xffffc0, 0xffffe0) # Add a legend box at (55, 18) using horizontal layout. Use 8 pt Arial font, with transparent # background c.addLegend(55, 18, false, "", 8).setBackground(ChartDirector::Transparent) # Add a title to the y-axis c.yAxis().setTitle("Throughput (MBytes Per Hour)") # Reserve 20 pixels at the top of the y-axis for the legend box c.yAxis().setTopMargin(20) # Set the x axis labels c.xAxis().setLabels(labels) # Add a multi-bar layer with 3 data sets and 3 pixels 3D depth layer = c.addBarLayer2(ChartDirector::Side, 3) layer.addDataSet(data0, 0xff8080, "Server #1") layer.addDataSet(data1, 0x80ff80, "Server #2") layer.addDataSet(data2, 0x8080ff, "Server #3") # Output the chart c.makeChart("multibar.png") |