require("chartdirector")
class MultidepthpieController < ApplicationController
def index()
@title = "Multi-Depth Pie Chart"
@ctrl_file = File.expand_path(__FILE__)
@noOfCharts = 1
render :template => "templates/chartview"
end
#
# Render and deliver the chart
#
def getchart()
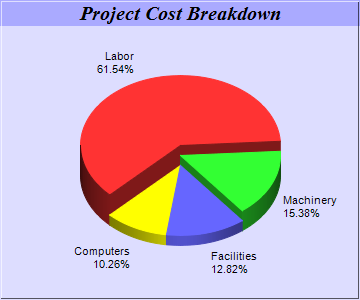
# The data for the pie chart
data = [72, 18, 15, 12]
# The labels for the pie chart
labels = ["Labor", "Machinery", "Facilities", "Computers"]
# The depths for the sectors
depths = [30, 20, 10, 10]
# Create a PieChart object of size 360 x 300 pixels, with a light blue (DDDDFF) background
# and a 1 pixel 3D border
c = ChartDirector::PieChart.new(360, 300, 0xddddff, -1, 1)
# Set the center of the pie at (180, 175) and the radius to 100 pixels
c.setPieSize(180, 175, 100)
# Add a title box using 15pt Times Bold Italic font and blue (AAAAFF) as background color
c.addTitle("Project Cost Breakdown", "timesbi.ttf", 15).setBackground(0xaaaaff)
# Set the pie data and the pie labels
c.setData(data, labels)
# Draw the pie in 3D with variable 3D depths
c.set3D2(depths)
# Set the start angle to 225 degrees may improve layout when the depths of the sector are
# sorted in descending order, because it ensures the tallest sector is at the back.
c.setStartAngle(225)
# Output the chart
send_data(c.makeChart2(ChartDirector::PNG), :type => "image/png", :disposition => "inline")
end
end |