require("chartdirector")
class MultipieController < ApplicationController
def index()
@title = "Multi-Pie Chart"
@ctrl_file = File.expand_path(__FILE__)
@noOfCharts = 3
render :template => "templates/chartview"
end
#
# Render and deliver the chart
#
def getchart()
# This script can draw different charts depending on the chartIndex
chartIndex = (params["img"]).to_i
# The data for the pie chart
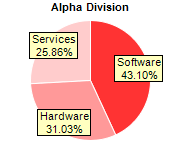
data0 = [25, 18, 15]
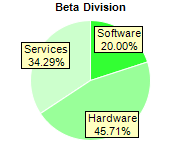
data1 = [14, 32, 24]
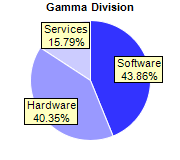
data2 = [25, 23, 9]
# The labels for the pie chart
labels = ["Software", "Hardware", "Services"]
# Create a PieChart object of size 180 x 160 pixels
c = ChartDirector::PieChart.new(180, 160)
# Set the center of the pie at (90, 80) and the radius to 60 pixels
c.setPieSize(90, 80, 60)
# Set the border color of the sectors to white (ffffff)
c.setLineColor(0xffffff)
# Set the background color of the sector label to pale yellow (ffffc0) with a black border
# (000000)
c.setLabelStyle().setBackground(0xffffc0, 0x000000)
# Set the label to be slightly inside the perimeter of the circle
c.setLabelLayout(ChartDirector::CircleLayout, -10)
# Set the title, data and colors according to which pie to draw
if chartIndex == 0
c.addTitle("Alpha Division", "arialbd.ttf", 8)
c.setData(data0, labels)
c.setColors2(ChartDirector::DataColor, [0xff3333, 0xff9999, 0xffcccc])
elsif chartIndex == 1
c.addTitle("Beta Division", "arialbd.ttf", 8)
c.setData(data1, labels)
c.setColors2(ChartDirector::DataColor, [0x33ff33, 0x99ff99, 0xccffcc])
else
c.addTitle("Gamma Division", "arialbd.ttf", 8)
c.setData(data2, labels)
c.setColors2(ChartDirector::DataColor, [0x3333ff, 0x9999ff, 0xccccff])
end
# Output the chart
send_data(c.makeChart2(ChartDirector::PNG), :type => "image/png", :disposition => "inline")
end
end |