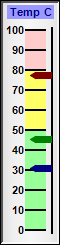
This example demonstrates a vertical linear meter with multiple pointers.
ChartDirector 6.0 (Ruby Edition)
Multi-Pointer Vertical Meter
Source Code Listing
require("chartdirector")

class MultivmeterController < ApplicationController

    def index()
        @title = "Multi-Pointer Vertical Meter"
        @ctrl_file = File.expand_path(__FILE__)
        @noOfCharts = 1
        render :template => "templates/chartview"
    end

    #
    # Render and deliver the chart
    #
    def getchart()
        # The values to display on the meter
        value0 = 30.99
        value1 = 45.35
        value2 = 77.64

        # Create an LinearMeter object of size 60 x 245 pixels, using silver background with a 2
        # pixel black 3D depressed border.
        m = ChartDirector::LinearMeter.new(60, 245, ChartDirector::silverColor(), 0, -2)

        # Set the scale region top-left corner at (25, 30), with size of 20 x 200 pixels. The scale
        # labels are located on the left (default - implies vertical meter)
        m.setMeter(25, 30, 20, 200)

        # Set meter scale from 0 - 100, with a tick every 10 units
        m.setScale(0, 100, 10)

        # Set 0 - 50 as green (99ff99) zone, 50 - 80 as yellow (ffff66) zone, and 80 - 100 as red
        # (ffcccc) zone
        m.addZone(0, 50, 0x99ff99)
        m.addZone(50, 80, 0xffff66)
        m.addZone(80, 100, 0xffcccc)

        # Add deep red (000080), deep green (008000) and deep blue (800000) pointers to reflect the
        # values
        m.addPointer(value0, 0x000080)
        m.addPointer(value1, 0x008000)
        m.addPointer(value2, 0x800000)

        # Add a text box label at top-center (30, 5) using Arial Bold/8pt/deep blue (000088), with a
        # light blue (9999ff) background
        m.addText(30, 5, "Temp C", "arialbd.ttf", 8, 0x000088, ChartDirector::TopCenter
            ).setBackground(0x9999ff)

        # Output the chart
        send_data(m.makeChart2(ChartDirector::PNG), :type => "image/png", :disposition => "inline")

    end

end |
<html>
<body style="margin:5px 0px 0px 5px">

<!-- Title -->
<div style="font-size:18pt; font-family:verdana; font-weight:bold">
    <%= @title %>
</div>
<hr style="border:solid 1px #000080" />

<!-- Source Code Listing Link -->
<div style="font-size:9pt; font-family:verdana; margin-bottom:1.5em">
    <%= link_to "Source Code Listing",
        :controller => "cddemo", :action => "viewsource",
        :ctrl_file => @ctrl_file, :view_file => File.expand_path(__FILE__) %>
</div>

<!-- Create one or more IMG tags to display the demo chart(s) -->
<% 0.upto(@noOfCharts - 1) do |i| %>
    <img src="<%= url_for(:action => "getchart", :img => i) %>">
<% end %>

</body>
</html> |
#!/usr/bin/env ruby
require("chartdirector")

# The values to display on the meter
value0 = 30.99
value1 = 45.35
value2 = 77.64

# Create an LinearMeter object of size 60 x 245 pixels, using silver background with a 2 pixel black
# 3D depressed border.
m = ChartDirector::LinearMeter.new(60, 245, ChartDirector::silverColor(), 0, -2)

# Set the scale region top-left corner at (25, 30), with size of 20 x 200 pixels. The scale labels
# are located on the left (default - implies vertical meter)
m.setMeter(25, 30, 20, 200)

# Set meter scale from 0 - 100, with a tick every 10 units
m.setScale(0, 100, 10)

# Set 0 - 50 as green (99ff99) zone, 50 - 80 as yellow (ffff66) zone, and 80 - 100 as red (ffcccc)
# zone
m.addZone(0, 50, 0x99ff99)
m.addZone(50, 80, 0xffff66)
m.addZone(80, 100, 0xffcccc)

# Add deep red (000080), deep green (008000) and deep blue (800000) pointers to reflect the values
m.addPointer(value0, 0x000080)
m.addPointer(value1, 0x008000)
m.addPointer(value2, 0x800000)

# Add a text box label at top-center (30, 5) using Arial Bold/8pt/deep blue (000088), with a light
# blue (9999ff) background
m.addText(30, 5, "Temp C", "arialbd.ttf", 8, 0x000088, ChartDirector::TopCenter).setBackground(
    0x9999ff)

# Output the chart
m.makeChart("multivmeter.png") |