require("chartdirector")
class PercentareaController < ApplicationController
def index()
@title = "Percentage Area Chart"
@ctrl_file = File.expand_path(__FILE__)
@noOfCharts = 1
render :template => "templates/chartview"
end
#
# Render and deliver the chart
#
def getchart()
# The data for the area chart
data0 = [42, 49, 33, 38, 51, 46, 29, 41, 44, 57, 59, 52, 37, 34, 51, 56, 56, 60, 70, 76, 63,
67, 75, 64, 51]
data1 = [50, 55, 47, 34, 42, 49, 63, 62, 73, 59, 56, 50, 64, 60, 67, 67, 58, 59, 73, 77, 84,
82, 80, 84, 98]
data2 = [87, 89, 85, 66, 53, 39, 24, 21, 37, 56, 37, 23, 21, 33, 13, 17, 14, 23, 16, 25, 29,
30, 45, 47, 46]
# The timestamps on the x-axis
labels = [Time.mktime(1996, 1, 1), Time.mktime(1996, 4, 1), Time.mktime(1996, 7, 1),
Time.mktime(1996, 10, 1), Time.mktime(1997, 1, 1), Time.mktime(1997, 4, 1), Time.mktime(
1997, 7, 1), Time.mktime(1997, 10, 1), Time.mktime(1998, 1, 1), Time.mktime(1998, 4, 1),
Time.mktime(1998, 7, 1), Time.mktime(1998, 10, 1), Time.mktime(1999, 1, 1), Time.mktime(
1999, 4, 1), Time.mktime(1999, 7, 1), Time.mktime(1999, 10, 1), Time.mktime(2000, 1, 1),
Time.mktime(2000, 4, 1), Time.mktime(2000, 7, 1), Time.mktime(2000, 10, 1), Time.mktime(
2001, 1, 1), Time.mktime(2001, 4, 1), Time.mktime(2001, 7, 1), Time.mktime(2001, 10, 1),
Time.mktime(2002, 1, 1)]
# Create a XYChart object of size 500 x 280 pixels, using 0xffffcc as background color, with
# a black border, and 1 pixel 3D border effect
c = ChartDirector::XYChart.new(500, 280, 0xffffcc, 0, 1)
# Set directory for loading images to current script directory
c.setSearchPath(File.dirname(__FILE__))
# Set the plotarea at (50, 45) and of size 320 x 200 pixels with white background. Enable
# horizontal and vertical grid lines using the grey (0xc0c0c0) color.
c.setPlotArea(50, 45, 320, 200, 0xffffff).setGridColor(0xc0c0c0, 0xc0c0c0)
# Add a legend box at (370, 45) using vertical layout and 8 points Arial Bold font.
legendBox = c.addLegend(370, 45, true, "arialbd.ttf", 8)
# Set the legend box background and border to transparent
legendBox.setBackground(ChartDirector::Transparent, ChartDirector::Transparent)
# Set the legend box icon size to 16 x 32 pixels to match with custom icon size
legendBox.setKeySize(16, 32)
# Add a title to the chart using 14 points Times Bold Itatic font and white font color, and
# 0x804020 as the background color
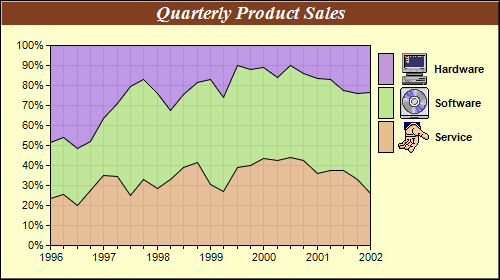
c.addTitle("Quarterly Product Sales", "timesbi.ttf", 14, 0xffffff).setBackground(0x804020)
# Set the labels on the x axis.
c.xAxis().setLabels2(labels)
# Set multi-style axis label formatting. Start of year labels are displayed as yyyy. For
# other labels, just show minor tick.
c.xAxis().setMultiFormat(ChartDirector::StartOfYearFilter(), "{value|yyyy}",
ChartDirector::AllPassFilter(), "-")
# Add a percentage area layer to the chart
layer = c.addAreaLayer2(ChartDirector::Percentage)
# Add the three data sets to the area layer, using icons images with labels as data set
# names
layer.addDataSet(data0, 0x40ddaa77,
"<*block,valign=absmiddle*><*img=service.png*> Service<*/*>")
layer.addDataSet(data1, 0x40aadd77,
"<*block,valign=absmiddle*><*img=software.png*> Software<*/*>")
layer.addDataSet(data2, 0x40aa77dd,
"<*block,valign=absmiddle*><*img=computer.png*> Hardware<*/*>")
# For a vertical stacked chart with positive data only, the last data set is always on top.
# However, in a vertical legend box, the last data set is at the bottom. This can be
# reversed by using the setLegend method.
layer.setLegend(ChartDirector::ReverseLegend)
# Output the chart
send_data(c.makeChart2(ChartDirector::PNG), :type => "image/png", :disposition => "inline")
end
end |