require("chartdirector")
class PolygonbarController < ApplicationController
def index()
@title = "Polygon Bar Shapes"
@ctrl_file = File.expand_path(__FILE__)
@noOfCharts = 1
render :template => "templates/chartview"
end
#
# Render and deliver the chart
#
def getchart()
# The data for the bar chart
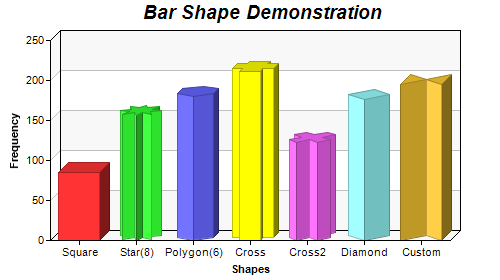
data = [85, 156, 179.5, 211, 123, 176, 195]
# The labels for the bar chart
labels = ["Square", "Star(8)", "Polygon(6)", "Cross", "Cross2", "Diamond", "Custom"]
# Create a XYChart object of size 500 x 280 pixels.
c = ChartDirector::XYChart.new(500, 280)
# Set the plotarea at (50, 40) with alternating light grey (f8f8f8) / white (ffffff)
# background
c.setPlotArea(50, 40, 400, 200, 0xf8f8f8, 0xffffff)
# Add a title to the chart using 14pt Arial Bold Italic font
c.addTitle(" Bar Shape Demonstration", "arialbi.ttf", 14)
# Add a multi-color bar chart layer
layer = c.addBarLayer3(data)
# Set layer to 3D with 10 pixels 3D depth
layer.set3D(10)
# Set bar shape to circular (cylinder)
layer.setBarShape(ChartDirector::CircleShape)
# Set the first bar (index = 0) to square shape
layer.setBarShape(ChartDirector::SquareShape, 0, 0)
# Set the second bar to 8-pointed star
layer.setBarShape(ChartDirector::StarShape(8), 0, 1)
# Set the third bar to 6-sided polygon
layer.setBarShape(ChartDirector::PolygonShape(6), 0, 2)
# Set the next 3 bars to cross shape, X shape and diamond shape
layer.setBarShape(ChartDirector::CrossShape(), 0, 3)
layer.setBarShape(ChartDirector::Cross2Shape(), 0, 4)
layer.setBarShape(ChartDirector::DiamondShape, 0, 5)
# Set the last bar to a custom shape, specified as an array of (x, y) points in normalized
# coordinates
layer.setBarShape2([-500, 0, 0, 500, 500, 0, 500, 1000, 0, 500, -500, 1000], 0, 6)
# Set the labels on the x axis.
c.xAxis().setLabels(labels)
# Add a title to the y axis
c.yAxis().setTitle("Frequency")
# Add a title to the x axis
c.xAxis().setTitle("Shapes")
# Output the chart
send_data(c.makeChart2(ChartDirector::PNG), :type => "image/png", :disposition => "inline")
end
end |