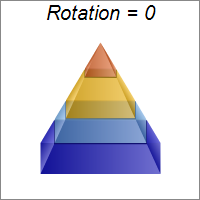
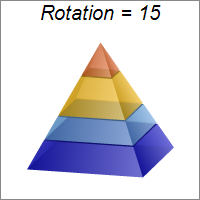
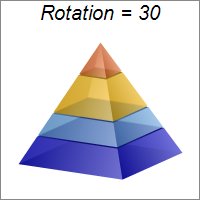
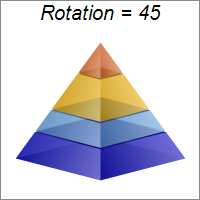
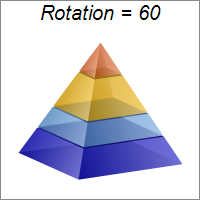
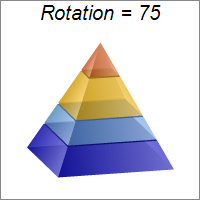
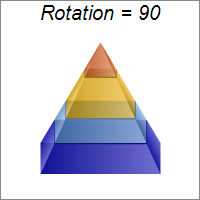
This example demonstrates viewing the pyramid at different rotation angles, configured with PyramidChart.setViewAngle.
ChartDirector 6.0 (Ruby Edition)
Pyramid Rotation
Source Code Listing
require("chartdirector")

class PyramidrotationController < ApplicationController

    def index()
        @title = "Pyramid Rotation"
        @ctrl_file = File.expand_path(__FILE__)
        @noOfCharts = 7
        render :template => "templates/chartview"
    end

    #
    # Render and deliver the chart
    #
    def getchart()
        # This script can draw different charts depending on the chartIndex
        chartIndex = (params["img"]).to_i

        # The data for the pyramid chart
        data = [156, 123, 211, 179]

        # The semi-transparent colors for the pyramid layers
        colors = [0x400000cc, 0x4066aaee, 0x40ffbb00, 0x40ee6622]

        # The rotation angle
        angle = chartIndex * 15

        # Create a PyramidChart object of size 200 x 200 pixels, with white (ffffff) background and
        # grey (888888) border
        c = ChartDirector::PyramidChart.new(200, 200, 0xffffff, 0x888888)

        # Set the pyramid center at (100, 100), and width x height to 60 x 120 pixels
        c.setPyramidSize(100, 100, 60, 120)

        # Set the elevation to 15 degrees and use the given rotation angle
        c.addTitle(sprintf("Rotation = %s", angle), "ariali.ttf", 15)
        c.setViewAngle(15, angle)

        # Set the pyramid data
        c.setData(data)

        # Set the layer colors to the given colors
        c.setColors2(ChartDirector::DataColor, colors)

        # Leave 1% gaps between layers
        c.setLayerGap(0.01)

        # Output the chart
        send_data(c.makeChart2(ChartDirector::PNG), :type => "image/png", :disposition => "inline")

    end

end |
<html>
<body style="margin:5px 0px 0px 5px">

<!-- Title -->
<div style="font-size:18pt; font-family:verdana; font-weight:bold">
    <%= @title %>
</div>
<hr style="border:solid 1px #000080" />

<!-- Source Code Listing Link -->
<div style="font-size:9pt; font-family:verdana; margin-bottom:1.5em">
    <%= link_to "Source Code Listing",
        :controller => "cddemo", :action => "viewsource",
        :ctrl_file => @ctrl_file, :view_file => File.expand_path(__FILE__) %>
</div>

<!-- Create one or more IMG tags to display the demo chart(s) -->
<% 0.upto(@noOfCharts - 1) do |i| %>
    <img src="<%= url_for(:action => "getchart", :img => i) %>">
<% end %>

</body>
</html> |
#!/usr/bin/env ruby
require("chartdirector")

def createChart(chartIndex)

    # The data for the pyramid chart
    data = [156, 123, 211, 179]

    # The semi-transparent colors for the pyramid layers
    colors = [0x400000cc, 0x4066aaee, 0x40ffbb00, 0x40ee6622]

    # The rotation angle
    angle = chartIndex * 15

    # Create a PyramidChart object of size 200 x 200 pixels, with white (ffffff) background and grey
    # (888888) border
    c = ChartDirector::PyramidChart.new(200, 200, 0xffffff, 0x888888)

    # Set the pyramid center at (100, 100), and width x height to 60 x 120 pixels
    c.setPyramidSize(100, 100, 60, 120)

    # Set the elevation to 15 degrees and use the given rotation angle
    c.addTitle(sprintf("Rotation = %s", angle), "ariali.ttf", 15)
    c.setViewAngle(15, angle)

    # Set the pyramid data
    c.setData(data)

    # Set the layer colors to the given colors
    c.setColors2(ChartDirector::DataColor, colors)

    # Leave 1% gaps between layers
    c.setLayerGap(0.01)

    # Output the chart
    c.makeChart("pyramidrotation%s.png" % chartIndex)
end

createChart(0)
createChart(1)
createChart(2)
createChart(3)
createChart(4)
createChart(5)
createChart(6) |