require("chartdirector")
class RectangularmeterController < ApplicationController
def index()
@title = "Rectangular Angular Meters"
@ctrl_file = File.expand_path(__FILE__)
@noOfCharts = 6
render :template => "templates/chartview"
end
#
# Render and deliver the chart
#
def getchart()
# This script can draw different charts depending on the chartIndex
chartIndex = (params["img"]).to_i
# The value to display on the meter
value = 72.55
# Create an AngularMeter object of size 240 x 170 pixels with very light grey (0xeeeeee)
# background, and a rounded 4-pixel thick light grey (0xcccccc) border
m = ChartDirector::AngularMeter.new(240, 170, 0xeeeeee, 0xcccccc)
m.setRoundedFrame(ChartDirector::Transparent)
m.setThickFrame(4)
# Set the default text and line colors to dark grey (0x222222)
m.setColor(ChartDirector::TextColor, 0x222222)
m.setColor(ChartDirector::LineColor, 0x222222)
# Center at (120, 145), scale radius = 128 pixels, scale angle -60 to +60 degrees
m.setMeter(120, 145, 128, -60, 60)
# Meter scale is 0 - 100, with major/minor/micro ticks every 20/10/5 units
m.setScale(0, 100, 20, 10, 5)
# Set the scale label style to 14pt Arial Italic. Set the major/minor/micro tick lengths to
# 16/16/10 pixels pointing inwards, and their widths to 2/1/1 pixels.
m.setLabelStyle("ariali.ttf", 14)
m.setTickLength(-16, -16, -10)
m.setLineWidth(0, 2, 1, 1)
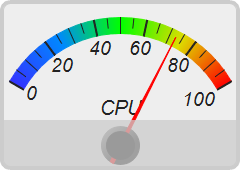
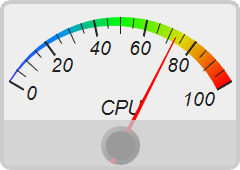
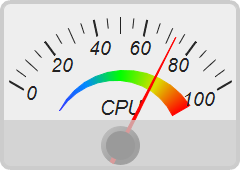
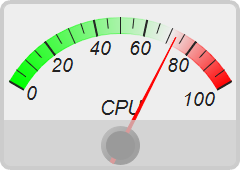
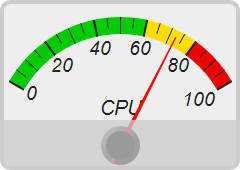
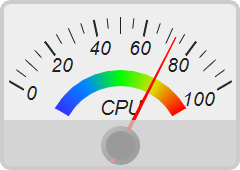
# Demostrate different types of color scales and putting them at different positions
smoothColorScale = [0, 0x3333ff, 25, 0x0088ff, 50, 0x00ff00, 75, 0xdddd00, 100, 0xff0000]
stepColorScale = [0, 0x00cc00, 60, 0xffdd00, 80, 0xee0000, 100]
highLowColorScale = [0, 0x00ff00, 70, ChartDirector::Transparent, 100, 0xff0000]
if chartIndex == 0
# Add the smooth color scale at the default position
m.addColorScale(smoothColorScale)
elsif chartIndex == 1
# Add the smooth color scale starting at radius 128 with zero width and ending at radius
# 128 with 16 pixels inner width
m.addColorScale(smoothColorScale, 128, 0, 128, -16)
elsif chartIndex == 2
# Add the smooth color scale starting at radius 70 with zero width and ending at radius
# 60 with 20 pixels outer width
m.addColorScale(smoothColorScale, 70, 0, 60, 20)
elsif chartIndex == 3
# Add the high/low color scale at the default position
m.addColorScale(highLowColorScale)
elsif chartIndex == 4
# Add the step color scale at the default position
m.addColorScale(stepColorScale)
else
# Add the smooth color scale at radius 60 with 15 pixels outer width
m.addColorScale(smoothColorScale, 60, 15)
end
# Add a text label centered at (120, 120) with 15pt Arial Italic font
m.addText(120, 120, "CPU", "ariali.ttf", 15, ChartDirector::TextColor,
ChartDirector::BottomCenter)
# Add a red (0xff0000) pointer at the specified value
m.addPointer2(value, 0xff0000)
# Add a semi-transparent light grey (0x3fcccccc) rectangle at (0, 120) and of size 240 x 60
# pixels to cover the bottom part of the meter for decoration
cover = m.addText(0, 120, "")
cover.setSize(240, 60)
cover.setBackground(0x3fcccccc)
# Output the chart
send_data(m.makeChart2(ChartDirector::PNG), :type => "image/png", :disposition => "inline")
end
end |