require("chartdirector")
class RotatedlineController < ApplicationController
def index()
@title = "Rotated Line Chart"
@ctrl_file = File.expand_path(__FILE__)
@noOfCharts = 1
render :template => "templates/chartview"
end
#
# Render and deliver the chart
#
def getchart()
#
# We use a random table to simulate generating 12 months of data
#
# Create the random table object with 4 cols * 12 rows, using 3 as seed
rantable = ChartDirector::RanTable.new(3, 4, 12)
# Set the 1st column to be the 12 months of year 2002
rantable.setDateCol(0, Time.mktime(2002, 1, 1), 86400 * 30)
# Set the 2nd, 3rd and 4th columns to be random numbers starting from 125, 75, and 100
# respectively. The change between rows is set to -35 to + 35. The minimum value of any cell
# is 0.
rantable.setCol(1, 125, -35, 35, 0)
rantable.setCol(2, 75, -35, 35, 0)
rantable.setCol(3, 100, -35, 35, 0)
# Get the 1st column (time) as the x data
dataX = rantable.getCol(0)
# Get the 2nd, 3rd and 4th columns as 3 data sets
dataY0 = rantable.getCol(1)
dataY1 = rantable.getCol(2)
dataY2 = rantable.getCol(3)
# Create a XYChart object of size 360 x 400 pixels
c = ChartDirector::XYChart.new(360, 400)
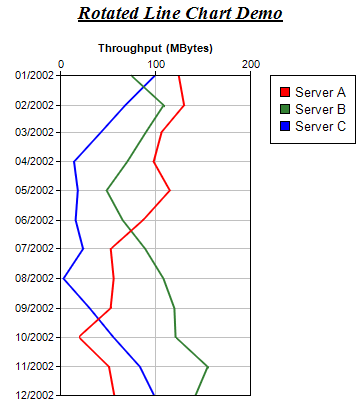
# Add a title to the chart
c.addTitle("<*underline=2*>Rotated Line Chart Demo", "timesbi.ttf", 14)
# Set the plotarea at (60, 75) and of size 190 x 320 pixels. Turn on both horizontal and
# vertical grid lines with light grey color (0xc0c0c0)
c.setPlotArea(60, 75, 190, 320).setGridColor(0xc0c0c0, 0xc0c0c0)
# Add a legend box at (270, 75)
c.addLegend(270, 75)
# Swap the x and y axis to become a rotated chart
c.swapXY()
# Set the y axis on the top side (right + rotated = top)
c.setYAxisOnRight()
# Add a title to the y axis
c.yAxis().setTitle("Throughput (MBytes)")
# Reverse the x axis so it is pointing downwards
c.xAxis().setReverse()
# Add a line chart layer using the given data
layer = c.addLineLayer2()
layer.setXData(dataX)
layer.addDataSet(dataY0, 0xff0000, "Server A")
layer.addDataSet(dataY1, 0x338033, "Server B")
layer.addDataSet(dataY2, 0x0000ff, "Server C")
# Set the line width to 2 pixels
layer.setLineWidth(2)
# Output the chart
send_data(c.makeChart2(ChartDirector::PNG), :type => "image/png", :disposition => "inline")
end
end |