require("chartdirector")
class RotatedpyramidController < ApplicationController
def index()
@title = "Rotated Pyramid Chart"
@ctrl_file = File.expand_path(__FILE__)
@noOfCharts = 1
render :template => "templates/chartview"
end
#
# Render and deliver the chart
#
def getchart()
# The data for the pyramid chart
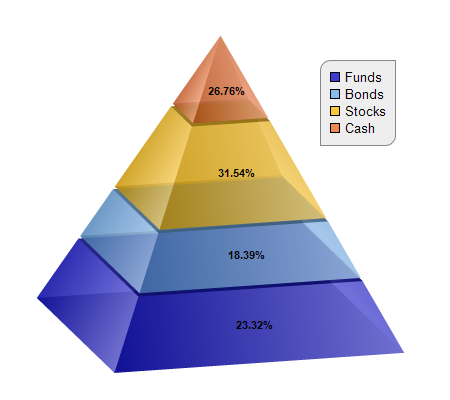
data = [156, 123, 211, 179]
# The labels for the pyramid chart
labels = ["Funds", "Bonds", "Stocks", "Cash"]
# The semi-transparent colors for the pyramid layers
colors = [0x400000cc, 0x4066aaee, 0x40ffbb00, 0x40ee6622]
# Create a PyramidChart object of size 450 x 400 pixels
c = ChartDirector::PyramidChart.new(450, 400)
# Set the pyramid center at (220, 180), and width x height to 150 x 300 pixels
c.setPyramidSize(220, 180, 150, 300)
# Set the elevation to 15 degrees and rotation to 75 degrees
c.setViewAngle(15, 75)
# Set the pyramid data and labels
c.setData(data, labels)
# Set the layer colors to the given colors
c.setColors2(ChartDirector::DataColor, colors)
# Leave 1% gaps between layers
c.setLayerGap(0.01)
# Add a legend box at (320, 60), with light grey (eeeeee) background and grey (888888)
# border. Set the top-left and bottom-right corners to rounded corners of 10 pixels radius.
legendBox = c.addLegend(320, 60)
legendBox.setBackground(0xeeeeee, 0x888888)
legendBox.setRoundedCorners(10, 0, 10, 0)
# Add labels at the center of the pyramid layers using Arial Bold font. The labels will show
# the percentage of the layers.
c.setCenterLabel("{percent}%", "arialbd.ttf")
# Output the chart
send_data(c.makeChart2(ChartDirector::PNG), :type => "image/png", :disposition => "inline")
end
end |