require("chartdirector")
class RoundmeterreadoutController < ApplicationController
def index()
@title = "Round Meters with Readout"
@ctrl_file = File.expand_path(__FILE__)
@noOfCharts = 2
render :template => "templates/chartview"
end
#
# Render and deliver the chart
#
def getchart()
# This script can draw different charts depending on the chartIndex
chartIndex = (params["img"]).to_i
# The value to display on the meter
value = 54
# The main color of the four meters in this example. The other colors and gradients are
# derived from the main color.
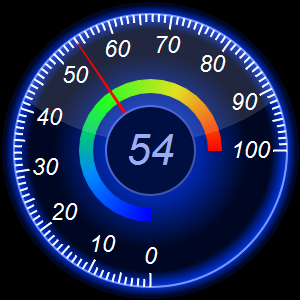
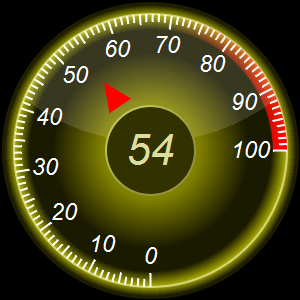
colorList = [0x0033dd, 0xaaaa00]
mainColor = colorList[chartIndex]
#
# In this example, we demonstrate how to parameterized by size, so that the chart size can
# be changed by changing just one variable.
#
size = 300
# The radius of the entire meter, which is size / 2, minus 2 pixels for margin
outerRadius = (size / 2 - 2).to_i
# The radius of the meter scale
scaleRadius = (outerRadius * 92 / 100).to_i
# The radius of the color scale
colorScaleRadius = (scaleRadius * 43 / 100).to_i
# The width of the color scale
colorScaleWidth = (scaleRadius * 10 / 100).to_i
# Major tick length
tickLength = (scaleRadius * 10 / 100).to_i
# Major tick width
tickWidth = (scaleRadius * 1 / 100 + 1).to_i
# Label font size
fontSize = (scaleRadius * 13 / 100).to_i
# Radius of readout circle as a ratio to the scale radius
readOutRadiusRatio = 0.333333333333
# Readout font size
readOutFontSize = (scaleRadius * 24 / 100).to_i
#
# Create an angular meter based on the above parameters
#
# Create an AngularMeter object of the specified size. In this demo, we use black (0x000000)
# as the background color. You can also use transparent or other colors.
m = ChartDirector::AngularMeter.new(size, size, 0x000000)
# Set the default text and line colors to white (0xffffff)
m.setColor(ChartDirector::TextColor, 0xffffff)
m.setColor(ChartDirector::LineColor, 0xffffff)
# Set meter center and scale radius, and set the scale angle from -180 to +90 degrees
m.setMeter(size / 2, size / 2, scaleRadius, -180, 90)
# Background gradient with the mainColor at the center and become darker near the border
bgGradient = [0, mainColor, 0.5, m.adjustBrightness(mainColor, 0.75), 1, m.adjustBrightness(
mainColor, 0.15)]
# Fill the meter background with the background gradient
m.addRing(0, outerRadius, m.relativeRadialGradient(bgGradient, outerRadius * 0.66))
# Gradient for the neon backlight, with the main color at the scale radius fading to
# transparent
neonGradient = [0.89, ChartDirector::Transparent, 1, mainColor, 1.07,
ChartDirector::Transparent]
m.addRing((scaleRadius * 85 / 100).to_i, outerRadius, m.relativeRadialGradient(neonGradient)
)
# The neon ring at the scale radius with width equal to 1/80 of the scale radius, creating
# using a brighter version of the main color
m.addRing(scaleRadius, (scaleRadius + scaleRadius / 80).to_i, m.adjustBrightness(mainColor,
2))
# Meter scale is 0 - 100, with major/minor/micro ticks every 10/5/1 units
m.setScale(0, 100, 10, 5, 1)
# Set the scale label style, tick length and tick width. The minor and micro tick lengths
# are 80% and 60% of the major tick length, and their widths are around half of the major
# tick width.
m.setLabelStyle("ariali.ttf", fontSize)
m.setTickLength(-tickLength, -(tickLength * 80 / 100).to_i, -(tickLength * 60 / 100).to_i)
m.setLineWidth(0, tickWidth, ((tickWidth + 1) / 2).to_i, ((tickWidth + 1) / 2).to_i)
# Demostrate different types of color scales and putting them at different positions.
smoothColorScale = [0, 0x0000ff, 25, 0x0088ff, 50, 0x00ff00, 75, 0xdddd00, 100, 0xff0000]
highColorScale = [70, ChartDirector::Transparent, 100, 0xff0000]
if chartIndex == 0
# Add the smooth color scale
m.addColorScale(smoothColorScale, colorScaleRadius, colorScaleWidth)
# Add a red (0xff0000) pointer
m.addPointer2(value, 0xff0000)
else
# Add the high color scale at the default position
m.addColorScale(highColorScale)
# Add a red (0xff0000) triangular pointer starting from 40% and ending at 60% of scale
# radius, with a width 6 times the default
m.addPointer2(value, 0xff0000, -1, ChartDirector::TriangularPointer2, 0.4, 0.6, 6)
end
# Configure a large "pointer cap" to be used as the readout circle at the center. The cap
# border width is set to 1.5% of the scale radius. The cap color is darker version of the
# main color. The border color is a brighter version of the main color with 75% brightness
# gradient effect.
m.setCap2(ChartDirector::Transparent, m.adjustBrightness(mainColor, 0.3),
m.adjustBrightness(mainColor, 1.5), 0.75, 0, readOutRadiusRatio, 0.015)
# Add value label at the center using a brighter version of the main color and Arial Italic
# font
m.addText(size / 2, size / 2, m.formatValue(value, "{value|0}"), "ariali.ttf",
readOutFontSize, m.adjustBrightness(mainColor, 2.5), ChartDirector::Center).setMargin(0)
# Add glare up to the scale radius
m.addGlare(scaleRadius)
# Output the chart
send_data(m.makeChart2(ChartDirector::PNG), :type => "image/png", :disposition => "inline")
end
end |