require("chartdirector")
class ScattercontourController < ApplicationController
def index()
@title = "Scattered Data Contour Chart"
@ctrl_file = File.expand_path(__FILE__)
@noOfCharts = 1
render :template => "templates/chartview"
end
#
# Render and deliver the chart
#
def getchart()
# The (x, y, z) coordinates of the scattered data
dataX = [0.5, 1.9, 4.9, 1.0, 8.9, 9.8, 5.9, 2.9, 6.8, 9.0, 0.0, 8.9, 1.9, 4.8, 2.4, 3.4,
7.9, 7.5, 4.8, 7.5, 9.5, 0.4, 8.9, 0.9, 5.4, 9.4, 2.9, 8.9, 0.9, 8.9, 10.0, 1.0, 6.8,
3.8, 9.0, 5.3, 6.4, 4.9, 4.5, 2.0, 5.4, 0.0, 10.0, 3.9, 5.4, 5.9, 5.8, 0.3, 4.4, 8.3]
dataY = [3.3, 3.0, 0.7, 1.0, 9.3, 4.5, 8.4, 0.1, 0.8, 0.1, 9.3, 1.8, 4.3, 1.3, 2.3, 5.4,
6.9, 9.0, 9.8, 7.5, 1.8, 1.4, 4.5, 7.8, 3.8, 4.0, 2.9, 2.4, 3.9, 2.9, 2.3, 9.3, 2.0,
3.4, 4.8, 2.3, 3.4, 2.3, 1.5, 7.8, 4.5, 0.9, 6.3, 2.4, 6.9, 2.8, 1.3, 2.9, 6.4, 6.3]
dataZ = [6.6, 12.5, 7.4, 6.2, 9.6, 13.6, 19.9, 2.2, 6.9, 3.4, 8.7, 8.4, 7.8, 8.0, 9.4, 11.9,
9.6, 15.7, 12.0, 13.3, 9.6, 6.4, 9.0, 6.9, 4.6, 9.7, 10.6, 9.2, 7.0, 6.9, 9.7, 8.6, 8.0,
13.6, 13.2, 5.9, 9.0, 3.2, 8.3, 9.7, 8.2, 6.1, 8.7, 5.6, 14.9, 9.8, 9.3, 5.1, 10.8, 9.8]
# Create a XYChart object of size 450 x 540 pixels
c = ChartDirector::XYChart.new(450, 540)
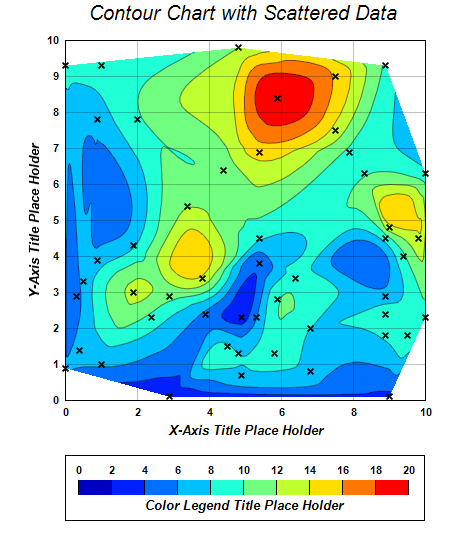
# Add a title to the chart using 15 points Arial Italic font
c.addTitle(" Contour Chart with Scattered Data", "ariali.ttf", 15)
# Set the plotarea at (65, 40) and of size 360 x 360 pixels. Use semi-transparent black
# (c0000000) for both horizontal and vertical grid lines
c.setPlotArea(65, 40, 360, 360, -1, -1, -1, 0xc0000000, -1)
# Set x-axis and y-axis title using 12 points Arial Bold Italic font
c.xAxis().setTitle("X-Axis Title Place Holder", "arialbi.ttf", 10)
c.yAxis().setTitle("Y-Axis Title Place Holder", "arialbi.ttf", 10)
# Set x-axis and y-axis labels to use Arial Bold font
c.xAxis().setLabelStyle("arialbd.ttf")
c.yAxis().setLabelStyle("arialbd.ttf")
# When x-axis and y-axis color to transparent
c.xAxis().setColors(ChartDirector::Transparent)
c.yAxis().setColors(ChartDirector::Transparent)
# Add a scatter layer to the chart to show the position of the data points
c.addScatterLayer(dataX, dataY, "", ChartDirector::Cross2Shape(0.2), 7, 0x000000)
# Add a contour layer using the given data
layer = c.addContourLayer(dataX, dataY, dataZ)
# Move the grid lines in front of the contour layer
c.getPlotArea().moveGridBefore(layer)
# Add a color axis (the legend) in which the top center is anchored at (245, 455). Set the
# length to 330 pixels and the labels on the top side.
cAxis = layer.setColorAxis(245, 455, ChartDirector::TopCenter, 330, ChartDirector::Top)
# Add a bounding box to the color axis using the default line color as border.
cAxis.setBoundingBox(ChartDirector::Transparent, ChartDirector::LineColor)
# Add a title to the color axis using 12 points Arial Bold Italic font
cAxis.setTitle("Color Legend Title Place Holder", "arialbi.ttf", 10)
# Set color axis labels to use Arial Bold font
cAxis.setLabelStyle("arialbd.ttf")
# Set the color axis range as 0 to 20, with a step every 2 units
cAxis.setLinearScale(0, 20, 2)
# Output the chart
send_data(c.makeChart2(ChartDirector::PNG), :type => "image/png", :disposition => "inline")
end
end |