require("chartdirector")
class ScattersurfaceController < ApplicationController
def index()
@title = "Scattered Data Surface Chart"
@ctrl_file = File.expand_path(__FILE__)
@noOfCharts = 1
render :template => "templates/chartview"
end
#
# Render and deliver the chart
#
def getchart()
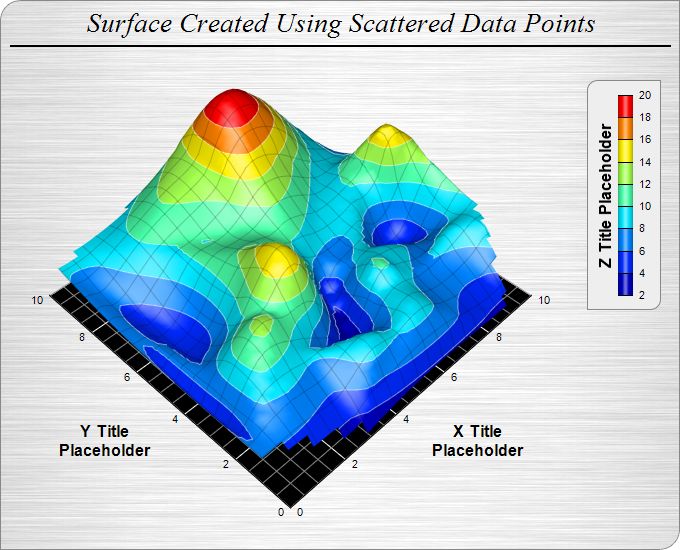
# The (x, y, z) coordinates of the scattered data
dataX = [0.5, 1.9, 4.9, 1.0, 8.9, 9.8, 5.9, 2.9, 6.8, 9.0, 0.0, 8.9, 1.9, 4.8, 2.4, 3.4,
7.9, 7.5, 4.8, 7.5, 9.5, 0.4, 8.9, 0.9, 5.4, 9.4, 2.9, 8.9, 0.9, 8.9, 10.0, 1.0, 6.8,
3.8, 9.0, 5.3, 6.4, 4.9, 4.5, 2.0, 5.4, 0.0, 10.0, 3.9, 5.4, 5.9, 5.8, 0.3, 4.4, 8.3]
dataY = [3.3, 3.0, 0.7, 1.0, 9.3, 4.5, 8.4, 0.1, 0.8, 0.1, 9.3, 1.8, 4.3, 1.3, 2.3, 5.4,
6.9, 9.0, 9.8, 7.5, 1.8, 1.4, 4.5, 7.8, 3.8, 4.0, 2.9, 2.4, 3.9, 2.9, 2.3, 9.3, 2.0,
3.4, 4.8, 2.3, 3.4, 2.3, 1.5, 7.8, 4.5, 0.9, 6.3, 2.4, 6.9, 2.8, 1.3, 2.9, 6.4, 6.3]
dataZ = [6.6, 12.5, 7.4, 6.2, 9.6, 13.6, 19.9, 2.2, 6.9, 3.4, 8.7, 8.4, 7.8, 8.0, 9.4, 11.9,
9.6, 15.7, 12.0, 13.3, 9.6, 6.4, 9.0, 6.9, 4.6, 9.7, 10.6, 9.2, 7.0, 6.9, 9.7, 8.6, 8.0,
13.6, 13.2, 5.9, 9.0, 3.2, 8.3, 9.7, 8.2, 6.1, 8.7, 5.6, 14.9, 9.8, 9.3, 5.1, 10.8, 9.8]
# Create a SurfaceChart object of size 680 x 550 pixels. Set background to brushed silver
# and border to grey (888888). Set the top-left and bottom-right corners to rounded corners
# with 20 pixels radius.
c = ChartDirector::SurfaceChart.new(680, 550, ChartDirector::brushedSilverColor(), 0x888888)
c.setRoundedFrame(0xffffff, 20, 0, 20, 0)
# Add a title to the chart using 20 points Times New Roman Italic font. Set top/bottom
# margin to 8 pixels.
title = c.addTitle("Surface Created Using Scattered Data Points", "timesi.ttf", 20)
title.setMargin2(0, 0, 8, 8)
# Add a 2 pixel wide black (000000) separator line under the title
c.addLine(10, title.getHeight(), c.getWidth() - 10, title.getHeight(), 0x000000, 2)
# Set the center of the plot region at (290, 235), and set width x depth x height to 360 x
# 360 x 180 pixels
c.setPlotRegion(290, 235, 360, 360, 180)
# Set the elevation and rotation angles to 45 and -45 degrees
c.setViewAngle(45, -45)
# Set the perspective level to 30
c.setPerspective(30)
# Set the data to use to plot the chart
c.setData(dataX, dataY, dataZ)
# Add a color axis (the legend) in which the top right corner is anchored at (660, 80). Set
# the length to 200 pixels and the labels on the right side.
cAxis = c.setColorAxis(660, 80, ChartDirector::TopRight, 200, ChartDirector::Right)
# Set the color axis title with 12 points Arial Bold font
cAxis.setTitle("Z Title Placeholder", "arialbd.ttf", 12)
# Add a bounding box with light grey (eeeeee) background and grey (888888) border. Set the
# top-left and bottom-right corners to rounded corners of 10 pixels radius.
cAxis.setBoundingBox(0xeeeeee, 0x888888)
cAxis.setRoundedCorners(10, 0, 10, 0)
# Set surface grid lines to semi-transparent black (cc000000)
c.setSurfaceAxisGrid(0xcc000000)
# Set contour lines to semi-transparent white (80ffffff)
c.setContourColor(0x80ffffff)
# Set the walls to black in color
c.setWallColor(0x000000)
# Set the xyz major wall grid lines to white (ffffff), and minor wall grid lines to grey
# (888888)
c.setWallGrid(0xffffff, 0xffffff, 0xffffff, 0x888888, 0x888888, 0x888888)
# Set the wall thickness to 0
c.setWallThickness(0, 0, 0)
# Show only the xy wall, and hide the yz and zx walls.
c.setWallVisibility(true, false, false)
# Set the x, y and z axis titles using 12 points Arial Bold font
c.xAxis().setTitle("X Title\nPlaceholder", "arialbd.ttf", 12)
c.yAxis().setTitle("Y Title\nPlaceholder", "arialbd.ttf", 12)
# Output the chart
send_data(c.makeChart2(ChartDirector::JPG), :type => "image/jpeg", :disposition => "inline")
end
end |