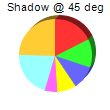
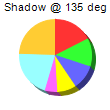
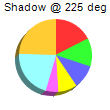
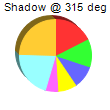
This example demonstrates an alternative 3D drawing method that uses shadows.
The standard way to draw a pie chart in 3D is to view the chart from an inclined angle. Using this method, the surface of a 3D pie will become an ellipse.
ChartDirector supports an alternative way to draw a pie chart in 3D - to draw the 3D portion like a shadow. The 3D pie will remain perfectly circular, and the sector areas will correctly reflect its percentages.
The 3D drawing method is configured using
PieChart.set3D.
[Ruby On Rails Version - Controller] app/controllers/shadowpie_controller.rb
require("chartdirector")

class ShadowpieController < ApplicationController

    def index()
        @title = "3D Shadow Mode"
        @ctrl_file = File.expand_path(__FILE__)
        @noOfCharts = 4
        render :template => "templates/chartview"
    end

    #
    # Render and deliver the chart
    #
    def getchart()
        # This script can draw different charts depending on the chartIndex
        chartIndex = (params["img"]).to_i

        # the tilt angle of the pie
        angle = chartIndex * 90 + 45

        # The data for the pie chart
        data = [25, 18, 15, 12, 8, 30, 35]

        # Create a PieChart object of size 110 x 110 pixels
        c = ChartDirector::PieChart.new(110, 110)

        # Set the center of the pie at (50, 55) and the radius to 36 pixels
        c.setPieSize(55, 55, 36)

        # Set the depth, tilt angle and 3D mode of the 3D pie (-1 means auto depth, "true" means the
        # 3D effect is in shadow mode)
        c.set3D(-1, angle, true)

        # Add a title showing the shadow angle
        c.addTitle(sprintf("Shadow @ %s deg", angle), "arial.ttf", 8)

        # Set the pie data
        c.setData(data)

        # Disable the sector labels by setting the color to Transparent
        c.setLabelStyle("", 8, ChartDirector::Transparent)

        # Output the chart
        send_data(c.makeChart2(ChartDirector::PNG), :type => "image/png", :disposition => "inline")

    end

end |
[Ruby On Rails Version - View] app/views/templates/chartview.html.erb
<html>
<body style="margin:5px 0px 0px 5px">

<!-- Title -->
<div style="font-size:18pt; font-family:verdana; font-weight:bold">
    <%= @title %>
</div>
<hr style="border:solid 1px #000080" />

<!-- Source Code Listing Link -->
<div style="font-size:9pt; font-family:verdana; margin-bottom:1.5em">
    <%= link_to "Source Code Listing",
        :controller => "cddemo", :action => "viewsource",
        :ctrl_file => @ctrl_file, :view_file => File.expand_path(__FILE__) %>
</div>

<!-- Create one or more IMG tags to display the demo chart(s) -->
<% 0.upto(@noOfCharts - 1) do |i| %>
    <img src="<%= url_for(:action => "getchart", :img => i) %>">
<% end %>

</body>
</html> |
[Command Line Version] rubydemo/shadowpie.rb
#!/usr/bin/env ruby
require("chartdirector")

def createChart(chartIndex)

    # the tilt angle of the pie
    angle = chartIndex * 90 + 45

    # The data for the pie chart
    data = [25, 18, 15, 12, 8, 30, 35]

    # Create a PieChart object of size 110 x 110 pixels
    c = ChartDirector::PieChart.new(110, 110)

    # Set the center of the pie at (50, 55) and the radius to 36 pixels
    c.setPieSize(55, 55, 36)

    # Set the depth, tilt angle and 3D mode of the 3D pie (-1 means auto depth, "true" means the 3D
    # effect is in shadow mode)
    c.set3D(-1, angle, true)

    # Add a title showing the shadow angle
    c.addTitle(sprintf("Shadow @ %s deg", angle), "arial.ttf", 8)

    # Set the pie data
    c.setData(data)

    # Disable the sector labels by setting the color to Transparent
    c.setLabelStyle("", 8, ChartDirector::Transparent)

    # Output the chart
    c.makeChart("shadowpie%s.png" % chartIndex)
end

createChart(0)
createChart(1)
createChart(2)
createChart(3) |
© 2017 Advanced Software Engineering Limited. All rights reserved.