ChartDirector 6.0 (Ruby Edition)

Simple Clickable Charts


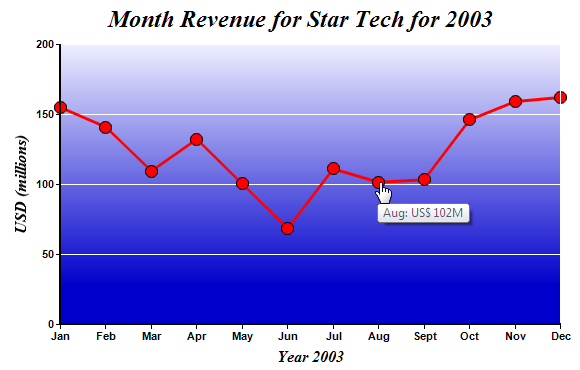
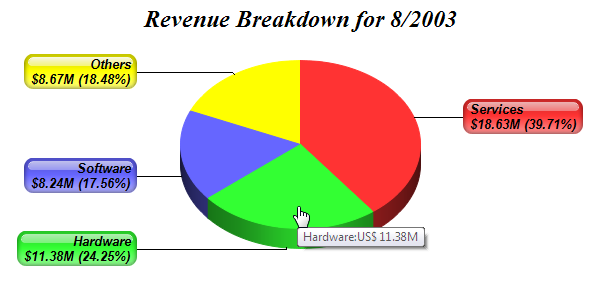
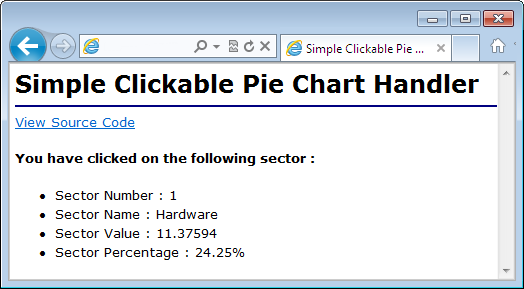
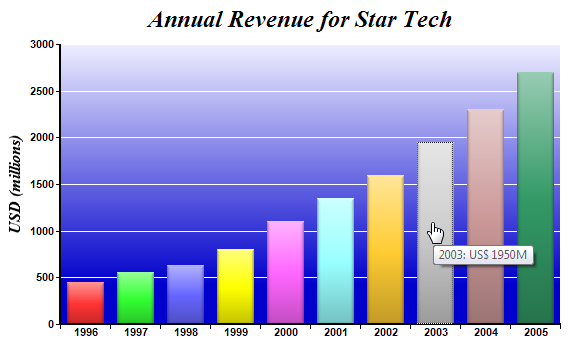
In this example, we will create a bar chart that displays the annual revenue of a company for the last 10 years. When a bar is clicked, the browser will load a line chart showing the monthly revenue for the selected year. When the line chart is clicked, the browser will load a pie chart showing the breakdown of the revenue for the selected month. When the pie chart is clicked, it will show the sector details in a web page.

The capability is often called "drill-down", because the user can get more details about an item by clicking on its representation on the chart.

Clickable Bar Chart


[Ruby On Rails Version - Controller] app/controllers/clickbar_controller.rb
require("chartdirector")

class ClickbarController < ApplicationController
    include ChartDirector::InteractiveChartSupport

    def index()
        @ctrl_file = File.expand_path(__FILE__)

        # The data for the bar chart
        data = [450, 560, 630, 800, 1100, 1350, 1600, 1950, 2300, 2700]

        # The labels for the bar chart
        labels = ["1996", "1997", "1998", "1999", "2000", "2001", "2002", "2003", "2004", "2005"]

        # Create a XYChart object of size 600 x 360 pixels
        c = ChartDirector::XYChart.new(600, 360)

        # Add a title to the chart using 18pt Times Bold Italic font
        c.addTitle("Annual Revenue for Star Tech", "timesbi.ttf", 18)

        # Set the plotarea at (60, 40) and of size 500 x 280 pixels. Use a vertical gradient color
        # from light blue (eeeeff) to deep blue (0000cc) as background. Set border and grid lines to
        # white (ffffff).
        c.setPlotArea(60, 40, 500, 280, c.linearGradientColor(60, 40, 60, 280, 0xeeeeff, 0x0000cc),
            -1, 0xffffff, 0xffffff)

        # Add a multi-color bar chart layer using the supplied data. Use soft lighting effect with
        # light direction from top.
        c.addBarLayer3(data).setBorderColor(ChartDirector::Transparent, ChartDirector::softLighting(
            ChartDirector::Top))

        # Set x axis labels using the given labels
        c.xAxis().setLabels(labels)

        # Draw the ticks between label positions (instead of at label positions)
        c.xAxis().setTickOffset(0.5)

        # When auto-scaling, use tick spacing of 40 pixels as a guideline
        c.yAxis().setTickDensity(40)

        # Add a title to the y axis with 12pt Times Bold Italic font
        c.yAxis().setTitle("USD (millions)", "timesbi.ttf", 12)

        # Set axis label style to 8pt Arial Bold
        c.xAxis().setLabelStyle("arialbd.ttf", 8)
        c.yAxis().setLabelStyle("arialbd.ttf", 8)

        # Set axis line width to 2 pixels
        c.xAxis().setWidth(2)
        c.yAxis().setWidth(2)

        # Create the image and save it in a temporary location
        session["chart1"] = c.makeChart2(ChartDirector::PNG)

        # Create an image map for the chart
        @imageMap = c.getHTMLImageMap(url_for(:controller => "clickline"), "",
            "title='{xLabel}: US$ {value|0}M'")
    end

end

[Ruby On Rails Version - View] app/views/clickbar/index.html.erb
<html>
<body style="margin:5px 0px 0px 5px">
<div style="font-size:18pt; font-family:verdana; font-weight:bold">
    Simple Clickable Bar Chart
</div>
<hr style="border:solid 1px #000080" />
<div style="font-size:10pt; font-family:verdana; margin-bottom:20">
    <%= link_to "Source Code Listing",
        :controller => "cddemo", :action => "viewsource",
        :ctrl_file => @ctrl_file, :view_file => File.expand_path(__FILE__) %>
</div>
<img src="<%= url_for(:action => 'get_session_data', :id => 'chart1',
    :nocache => rand) %>" border="0" usemap="#map1">
<map name="map1">
<%= raw(@imageMap) %>
</map>
</body>
</html>

In the above code, the chart is created and saved in a session variable "chart1". An <IMG> tag in the view is used to retrieve the chart using the "get_session_data" action.

<img src="<%= url_for(:action => 'get_session_data', :id => 'chart1',
    :nocache => rand) %>" border="0" usemap="#map1">

The "get_session_data" action is a ChartDirector utility implemented in the InteractiveChartSupport class. Controllers that need to use session variables for charts should include InteractiveChartSupport as mixin.

The image map for the chart is created using the following code:

@imageMap = c.getHTMLImageMap(url_for(:controller => "clickline"), "",
    "title='{xLabel}: US$ {value|0}M'")

As seen above, only one line of code is needed. BaseChart.getHTMLImageMap will generate the image map for the entire chart. The image map will use the "clickline" controller as the handler when a bar is clicked.

If you right click on the browser and choose "View Source" to look at the HTML of the web page as received by the browser, you can see that the image map generated above will be something like:

<area shape="rect" coords="67,278,103,320" title='1996: US$ 450M'
    href="http://chartdirector/clickline?x=0&xLabel=1996&dataSet=0&dataSetName=&value=450">

<area shape="rect" coords="117,268,153,320" title='1997: US$ 560M'
    href="http://chartdirector/clickline?x=1&xLabel=1997&dataSet=1&dataSetName=&value=560">

<area shape="rect" coords="167,261,203,320" title='1998: US$ 630M'
    href="http://chartdirector/clickline?x=2&xLabel=1998&dataSet=2&dataSetName=&value=630">

<area shape="rect" coords="217,245,253,320" title='1999: US$ 800M'
    href="http://chartdirector/clickline?x=3&xLabel=1999&dataSet=3&dataSetName=&value=800">

...... (one <area> tag for each bar) ......

The image map generated by ChartDirector contains one <AREA> tag per bar. This defines the bars as hot spots. The "href" attribute of the <AREA> tag includes the handler URL as well as query parameters about the bar. This allows the handler to distinguish which bar the user has clicked.

The <AREA> tags also include "title" attributes, which act as pop up tooltips. In this example, the tooltips are in the format:

"title='{xLabel}: US$ {value|0}M'"

which is specified as the third argument of BaseChart.getHTMLImageMap.

Clickable Line Chart


In the previous Clickable Bar Chart sample code, when a bar is clicked, the "clickline" controller will be invoked.

The code for the handler is listed below. It determines which year the user has clicked from query parameters. It then creates a clickable line chart for that year using the "clickpie" controller as the click handler. As the code is similar to the Clickable Bar Chart, it will not be explained further.

[Ruby On Rails Version - Controller] app/controllers/clickline_controller.rb
require("chartdirector")

class ClicklineController < ApplicationController
    include ChartDirector::InteractiveChartSupport

    def index()
        @ctrl_file = File.expand_path(__FILE__)

        # Get the selected year.
        selectedYear = params["xLabel"]

        #
        # In real life, the data may come from a database based on selectedYear. In this example, we
        # just use a random number generator.
        #
        seed = 50 + (selectedYear.to_i - 1996) * 15
        rantable = ChartDirector::RanTable.new(seed, 1, 12)
        rantable.setCol2(0, seed, -seed * 0.25, seed * 0.33, seed * 0.1, seed * 3)

        data = rantable.getCol(0)

        #
        # Now we obtain the data into arrays, we can start to draw the chart using ChartDirector
        #

        # Create a XYChart object of size 600 x 320 pixels
        c = ChartDirector::XYChart.new(600, 360)

        # Add a title to the chart using 18pt Times Bold Italic font
        c.addTitle(sprintf("Month Revenue for Star Tech for %s", selectedYear), "timesbi.ttf", 18)

        # Set the plotarea at (60, 40) and of size 500 x 280 pixels. Use a vertical gradient color
        # from light blue (eeeeff) to deep blue (0000cc) as background. Set border and grid lines to
        # white (ffffff).
        c.setPlotArea(60, 40, 500, 280, c.linearGradientColor(60, 40, 60, 280, 0xeeeeff, 0x0000cc),
            -1, 0xffffff, 0xffffff)

        # Add a red line (ff0000) chart layer using the data
        dataSet = c.addLineLayer().addDataSet(data, 0xff0000, "Revenue")

        # Set the line width to 3 pixels
        dataSet.setLineWidth(3)

        # Use a 13 point circle symbol to plot the data points
        dataSet.setDataSymbol(ChartDirector::CircleSymbol, 13)

        # Set the labels on the x axis. In this example, the labels must be Jan - Dec.
        labels = ["Jan", "Feb", "Mar", "Apr", "May", "Jun", "Jul", "Aug", "Sept", "Oct", "Nov",
            "Dec"]
        c.xAxis().setLabels(labels)

        # When auto-scaling, use tick spacing of 40 pixels as a guideline
        c.yAxis().setTickDensity(40)

        # Add a title to the x axis to reflect the selected year
        c.xAxis().setTitle(sprintf("Year %s", selectedYear), "timesbi.ttf", 12)

        # Add a title to the y axis
        c.yAxis().setTitle("USD (millions)", "timesbi.ttf", 12)

        # Set axis label style to 8pt Arial Bold
        c.xAxis().setLabelStyle("arialbd.ttf", 8)
        c.yAxis().setLabelStyle("arialbd.ttf", 8)

        # Set axis line width to 2 pixels
        c.xAxis().setWidth(2)
        c.yAxis().setWidth(2)

        # Create the image and save it in a temporary location
        session["chart1"] = c.makeChart2(ChartDirector::PNG)

        # Create an image map for the chart
        @imageMap = c.getHTMLImageMap(url_for(:controller => "clickpie", :year => selectedYear), "",
            "title='{xLabel}: US$ {value|0}M'")
    end

end

[Ruby On Rails Version - View] app/views/clickline/index.html.erb
<html>
<body style="margin:5px 0px 0px 5px">
<div style="font-size:18pt; font-family:verdana; font-weight:bold">
    Simple Clickable Line Chart
</div>
<hr style="border:solid 1px #000080" />
<div style="font-size:10pt; font-family:verdana; margin-bottom:20">
    <%= link_to "Source Code Listing",
        :controller => "cddemo", :action => "viewsource",
        :ctrl_file => @ctrl_file, :view_file => File.expand_path(__FILE__) %>
</div>
<img src="<%= url_for(:action => 'get_session_data', :id => 'chart1',
    :nocache => rand) %>" border="0" usemap="#map1">
<map name="map1">
<%= raw(@imageMap) %>
</map>
</body>
</html>

Clickable Pie Chart


In the previous Clickable Line Chart sample code, when a line is clicked, the "clickpie" controller will be invoked.

The code for the handler is listed below. It determines which year and month the user has clicked from query parameters. It then creates a clickable pie chart for that year and month, using the "piestub" controller as the click handler. As the code is very similar to the Clickable Bar Chart, it will not be explained further.

[Ruby On Rails Version - Controller] app/controllers/clickpie_controller.rb
require("chartdirector")

class ClickpieController < ApplicationController
    include ChartDirector::InteractiveChartSupport

    def index()
        @ctrl_file = File.expand_path(__FILE__)

        # Get the selected year and month
        selectedYear = (params["year"]).to_i
        selectedMonth = (params["x"]).to_i + 1

        #
        # In real life, the data may come from a database based on selectedYear. In this example, we
        # just use a random number generator.
        #
        seed = (selectedYear - 1992) * (100 + 3 * selectedMonth)
        rantable = ChartDirector::RanTable.new(seed, 1, 4)
        rantable.setCol(0, seed * 0.003, seed * 0.017)

        data = rantable.getCol(0)

        # The labels for the pie chart
        labels = ["Services", "Hardware", "Software", "Others"]

        # Create a PieChart object of size 600 x 240 pixels
        c = ChartDirector::PieChart.new(600, 280)

        # Set the center of the pie at (300, 140) and the radius to 120 pixels
        c.setPieSize(300, 140, 120)

        # Add a title to the pie chart using 18pt Times Bold Italic font
        c.addTitle(sprintf("Revenue Breakdown for %s/%s", selectedMonth, selectedYear),
            "timesbi.ttf", 18)

        # Draw the pie in 3D with 20 pixels 3D depth
        c.set3D(20)

        # Set label format to display sector label, value and percentage in two lines
        c.setLabelFormat("{label}<*br*>${value|2}M ({percent}%)")

        # Set label style to 10pt Arial Bold Italic font. Set background color to the same as the
        # sector color, with reduced-glare glass effect and rounded corners.
        t = c.setLabelStyle("arialbi.ttf", 10)
        t.setBackground(ChartDirector::SameAsMainColor, ChartDirector::Transparent,
            ChartDirector::glassEffect(ChartDirector::ReducedGlare))
        t.setRoundedCorners()

        # Use side label layout method
        c.setLabelLayout(ChartDirector::SideLayout)

        # Set the pie data and the pie labels
        c.setData(data, labels)

        # Create the image and save it in a temporary location
        session["chart1"] = c.makeChart2(ChartDirector::PNG)

        # Create an image map for the chart
        @imageMap = c.getHTMLImageMap(url_for(:controller => "piestub"), "",
            "title='{label}:US$ {value|2}M'")
    end

end

[Ruby On Rails Version - View] app/views/clickpie/index.html.erb
<html>
<body style="margin:5px 0px 0px 5px">
<div style="font-size:18pt; font-family:verdana; font-weight:bold">
    Simple Clickable Pie Chart
</div>
<hr style="border:solid 1px #000080" />
<div style="font-size:10pt; font-family:verdana; margin-bottom:20">
    <%= link_to "Source Code Listing",
        :controller => "cddemo", :action => "viewsource",
        :ctrl_file => @ctrl_file, :view_file => File.expand_path(__FILE__) %>
</div>
<img src="<%= url_for(:action => 'get_session_data', :id => 'chart1',
    :nocache => rand) %>" border="0" usemap="#map1">
<map name="map1">
<%= raw(@imageMap) %>
</map>
</body>
</html>

Clickable Pie Chart Handler


In the previous Clickable Pie Chart sample code, when a sector is clicked, the "piestub" controller will be invoked. Its code is listed below. In this example, it simply displays some data about the sector.

[Ruby On Rails Version - Controller] app/controllers/piestub_controller.rb
class PiestubController < ApplicationController
    def index()
        @ctrl_file = File.expand_path(__FILE__)
    end
end

[Ruby On Rails Version - View] app/views/piestub/index.html.erb
<html>
<body style="margin:5px 0px 0px 5px">
<div style="font-size:18pt; font-family:verdana; font-weight:bold">
    Simple Clickable Pie Chart Handler
</div>
<hr style="border:solid 1px #000080" />
<div style="font-size:10pt; font-family:verdana; margin-bottom:20px">
    <%= link_to "Source Code Listing",
        :controller => "cddemo", :action => "viewsource",
        :ctrl_file => @ctrl_file, :view_file => File.expand_path(__FILE__) %>
</div>
<div style="font-size:10pt; font-family:verdana;">
<b>You have clicked on the following sector :</b><br />
<ul>
    <li>Sector Number : <%= params["sector"] %></li>
    <li>Sector Name : <%= params["label"] %></li>
    <li>Sector Value : <%= params["value"] %></li>
    <li>Sector Percentage : <%= params["percent"] %>%</li>
</ul>
</div>
</body>
</html>