This example demonstrates the basic steps in creating pyramid charts.
[Ruby On Rails Version - Controller] app/controllers/simplepyramid_controller.rb
require("chartdirector")
class SimplepyramidController < ApplicationController
def index()
@title = "Simple Pyramid Chart"
@ctrl_file = File.expand_path(__FILE__)
@noOfCharts = 1
render :template => "templates/chartview"
end
#
# Render and deliver the chart
#
def getchart()
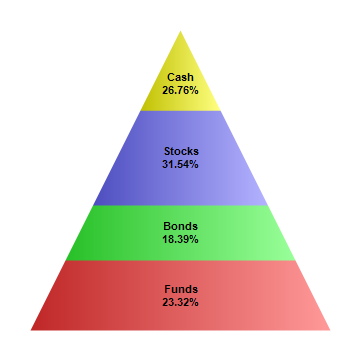
# The data for the pyramid chart
data = [156, 123, 211, 179]
# The labels for the pyramid chart
labels = ["Funds", "Bonds", "Stocks", "Cash"]
# Create a PyramidChart object of size 360 x 360 pixels
c = ChartDirector::PyramidChart.new(360, 360)
# Set the pyramid center at (180, 180), and width x height to 150 x 180 pixels
c.setPyramidSize(180, 180, 150, 300)
# Set the pyramid data and labels
c.setData(data, labels)
# Add labels at the center of the pyramid layers using Arial Bold font. The labels will have
# two lines showing the layer name and percentage.
c.setCenterLabel("{label}\n{percent}%", "arialbd.ttf")
# Output the chart
send_data(c.makeChart2(ChartDirector::PNG), :type => "image/png", :disposition => "inline")
end
end |
[Ruby On Rails Version - View] app/views/templates/chartview.html.erb
<html>
<body style="margin:5px 0px 0px 5px">

<!-- Title -->
<div style="font-size:18pt; font-family:verdana; font-weight:bold">
    <%= @title %>
</div>
<hr style="border:solid 1px #000080" />

<!-- Source Code Listing Link -->
<div style="font-size:9pt; font-family:verdana; margin-bottom:1.5em">
    <%= link_to "Source Code Listing",
        :controller => "cddemo", :action => "viewsource",
        :ctrl_file => @ctrl_file, :view_file => File.expand_path(__FILE__) %>
</div>

<!-- Create one or more IMG tags to display the demo chart(s) -->
<% 0.upto(@noOfCharts - 1) do |i| %>
    <img src="<%= url_for(:action => "getchart", :img => i) %>">
<% end %>

</body>
</html> |
[Command Line Version] rubydemo/simplepyramid.rb
#!/usr/bin/env ruby
require("chartdirector")

# The data for the pyramid chart
data = [156, 123, 211, 179]

# The labels for the pyramid chart
labels = ["Funds", "Bonds", "Stocks", "Cash"]

# Create a PyramidChart object of size 360 x 360 pixels
c = ChartDirector::PyramidChart.new(360, 360)

# Set the pyramid center at (180, 180), and width x height to 150 x 180 pixels
c.setPyramidSize(180, 180, 150, 300)

# Set the pyramid data and labels
c.setData(data, labels)

# Add labels at the center of the pyramid layers using Arial Bold font. The labels will have two
# lines showing the layer name and percentage.
c.setCenterLabel("{label}\n{percent}%", "arialbd.ttf")

# Output the chart
c.makeChart("simplepyramid.png") |
© 2017 Advanced Software Engineering Limited. All rights reserved.