require("chartdirector")
class SimplezoomscrollController < ApplicationController
include ChartDirector::InteractiveChartSupport
private
#
# Initialize the WebChartViewer when the page is first loaded
#
def initViewer(viewer)
# The full x-axis range is from Jan 1, 2007 to Jan 1, 2012
startDate = Time.mktime(2010, 1, 1)
endDate = Time.mktime(2015, 1, 1)
viewer.setFullRange("x", startDate, endDate)
# Initialize the view port to show the last 366 days (out of 1826 days)
viewer.setViewPortWidth(366.0 / 1826)
viewer.setViewPortLeft(1 - viewer.getViewPortWidth())
# Set the maximum zoom to 10 days (out of 1826 days)
viewer.setZoomInWidthLimit(10.0 / 1826)
end
#
# Create a random table for demo purpose.
#
def getRandomTable()
r = ChartDirector::RanTable.new(127, 4, 1828)
r.setDateCol(0, Time.mktime(2010, 1, 1), 86400)
r.setCol(1, 150, -10, 10)
r.setCol(2, 200, -10, 10)
r.setCol(3, 250, -8, 8)
return r
end
#
# Draw the chart
#
def drawChart(viewer)
# Determine the visible x-axis range
viewPortStartDate = viewer.getValueAtViewPort("x", viewer.getViewPortLeft())
viewPortEndDate = viewer.getValueAtViewPort("x", viewer.getViewPortLeft(
) + viewer.getViewPortWidth())
# We need to get the data within the visible x-axis range. In real code, this can be by
# using a database query or some other means as specific to the application. In this demo,
# we just generate a random data table, and then select the data within the table.
r = getRandomTable()
# Select the data for the visible date range viewPortStartDate to viewPortEndDate. It is
# possible there is no data point at exactly viewPortStartDate or viewPortEndDate. In this
# case, we also need the data points that are just outside the visible date range to
# "overdraw" the line a little bit (the "overdrawn" part will be clipped to the plot area)
# In this demo, we do this by adding a one day margin to the date range when selecting the
# data.
r.selectDate(0, viewPortStartDate - 86400, viewPortEndDate + 86400)
# The selected data from the random data table
timeStamps = r.getCol(0)
dataSeriesA = r.getCol(1)
dataSeriesB = r.getCol(2)
dataSeriesC = r.getCol(3)
#
# Now we have obtained the data, we can plot the chart.
#
#================================================================================
# Configure overall chart appearance.
#================================================================================
# Create an XYChart object 600 x 300 pixels in size, with pale blue (f0f0ff) background,
# black (000000) rounded border, 1 pixel raised effect.
c = ChartDirector::XYChart.new(600, 300, 0xf0f0ff, 0x000000)
c.setRoundedFrame()
# Set the plotarea at (52, 60) and of size 520 x 205 pixels. Use white (ffffff) background.
# Enable both horizontal and vertical grids by setting their colors to grey (cccccc). Set
# clipping mode to clip the data lines to the plot area.
c.setPlotArea(55, 60, 520, 205, 0xffffff, -1, -1, 0xcccccc, 0xcccccc)
# As the data can lie outside the plotarea in a zoomed chart, we need to enable clipping.
c.setClipping()
# Add a top title to the chart using 15pt Times New Roman Bold Italic font, with a light
# blue (ccccff) background, black (000000) border, and a glass like raised effect.
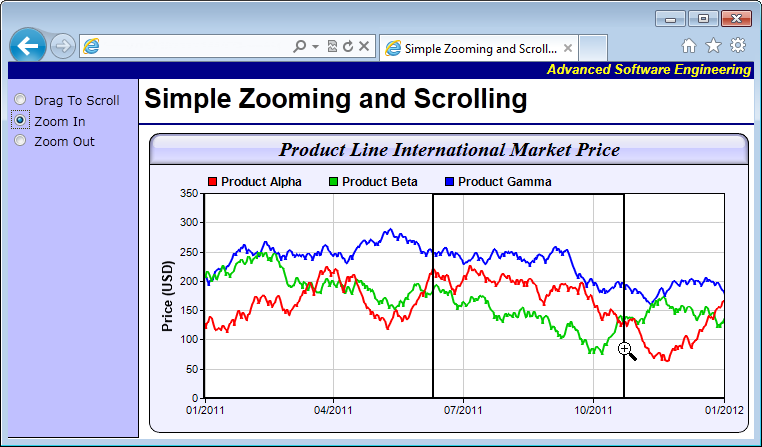
c.addTitle("Product Line International Market Price", "timesbi.ttf", 15).setBackground(
0xccccff, 0x000000, ChartDirector::glassEffect())
# Add a legend box at the top of the plot area with 9pt Arial Bold font with flow layout.
c.addLegend(50, 33, false, "arialbd.ttf", 9).setBackground(ChartDirector::Transparent,
ChartDirector::Transparent)
# Set axes width to 2 pixels
c.xAxis().setWidth(2)
c.yAxis().setWidth(2)
# Add a title to the y-axis
c.yAxis().setTitle("Price (USD)", "arialbd.ttf", 10)
#================================================================================
# Add data to chart
#================================================================================
#
# In this example, we represent the data by lines. You may modify the code below to use
# other representations (areas, scatter plot, etc).
#
# Add a line layer for the lines, using a line width of 2 pixels
layer = c.addLineLayer2()
layer.setLineWidth(2)
# In this demo, we do not have too many data points. In real code, the chart may contain a
# lot of data points when fully zoomed out - much more than the number of horizontal pixels
# in this plot area. So it is a good idea to use fast line mode.
layer.setFastLineMode()
# Now we add the 3 data series to a line layer, using the color red (ff0000), green (00cc00)
# and blue (0000ff)
layer.setXData(timeStamps)
layer.addDataSet(dataSeriesA, 0xff0000, "Product Alpha")
layer.addDataSet(dataSeriesB, 0x00cc00, "Product Beta")
layer.addDataSet(dataSeriesC, 0x0000ff, "Product Gamma")
#================================================================================
# Configure axis scale and labelling
#================================================================================
# Set the x-axis as a date/time axis with the scale according to the view port x range.
viewer.syncDateAxisWithViewPort("x", c.xAxis())
# In this demo, we rely on ChartDirector to auto-label the axis. We ask ChartDirector to
# ensure the x-axis labels are at least 75 pixels apart to avoid too many labels.
c.xAxis().setTickDensity(75)
#================================================================================
# Output the chart
#================================================================================
# Create the image and save it in a session variable
session[viewer.getId()] = c.makeChart2(ChartDirector::PNG)
# Include tool tip for the chart
imageMap = c.getHTMLImageMap("", "",
"title='[{dataSetName}] {x|mmm dd, yyyy}: USD {value|2}'")
# Set the chart URL, image map and chart metrics to the viewer
viewer.setImageUrl(url_for(:action => "get_session_data", :id => viewer.getId(),
:nocache => rand))
viewer.setImageMap(imageMap)
viewer.setChartMetrics(c.getChartMetrics())
end
public
def index()
#
# This script handles both the full page request, as well as the subsequent partial updates
# (AJAX chart updates). We need to determine the type of request first before we processing
# it.
#
# Create the WebChartViewer object
@viewer = ChartDirector::WebChartViewer.new(request, "chart1")
if @viewer.isPartialUpdateRequest()
# Is a partial update request. Draw the chart and perform a partial response.
drawChart(@viewer)
send_data(@viewer.partialUpdateChart(), :type => "text/html; charset=utf-8",
:disposition => "inline")
return
end
#
# If the code reaches here, it is a full page request.
#
# In this exapmle, we just need to initialize the WebChartViewer and draw the chart.
initViewer(@viewer)
drawChart(@viewer)
end
end |