require("chartdirector")
class SmoothcontourController < ApplicationController
def index()
@title = "Continuous Contour Coloring"
@ctrl_file = File.expand_path(__FILE__)
@noOfCharts = 1
render :template => "templates/chartview"
end
#
# Render and deliver the chart
#
def getchart()
# The x and y coordinates of the grid
dataX = [-10, -9, -8, -7, -6, -5, -4, -3, -2, -1, 0, 1, 2, 3, 4, 5, 6, 7, 8, 9, 10]
dataY = [-10, -9, -8, -7, -6, -5, -4, -3, -2, -1, 0, 1, 2, 3, 4, 5, 6, 7, 8, 9, 10]
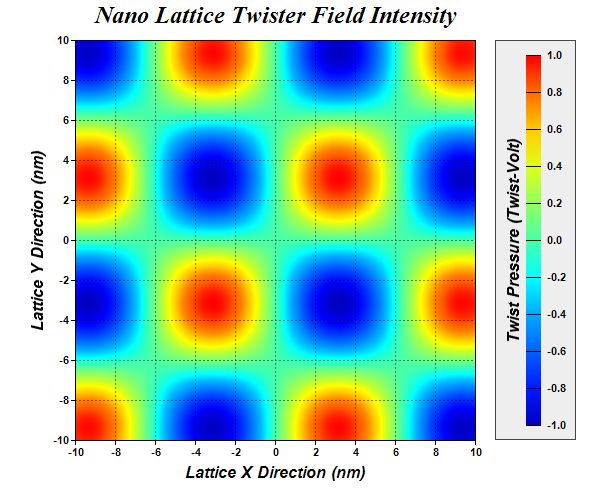
# The values at the grid points. In this example, we will compute the values using the
# formula z = Sin(x / 2) * Sin(y / 2).
dataZ = Array.new(dataX.length * dataY.length, 0)
0.upto(dataY.length - 1) do |yIndex|
y = dataY[yIndex]
0.upto(dataX.length - 1) do |xIndex|
x = dataX[xIndex]
dataZ[yIndex * dataX.length + xIndex] = Math.sin(x / 2.0) * Math.sin(y / 2.0)
end
end
# Create a XYChart object of size 600 x 500 pixels
c = ChartDirector::XYChart.new(600, 500)
# Add a title to the chart using 18 points Times New Roman Bold Italic font
c.addTitle("Nano Lattice Twister Field Intensity ", "timesbi.ttf", 18)
# Set the plotarea at (75, 40) and of size 400 x 400 pixels. Use semi-transparent black
# (80000000) dotted lines for both horizontal and vertical grid lines
c.setPlotArea(75, 40, 400, 400, -1, -1, -1, c.dashLineColor(0x80000000,
ChartDirector::DotLine), -1)
# Set x-axis and y-axis title using 12 points Arial Bold Italic font
c.xAxis().setTitle("Lattice X Direction (nm)", "arialbi.ttf", 12)
c.yAxis().setTitle("Lattice Y Direction (nm)", "arialbi.ttf", 12)
# Set x-axis and y-axis labels to use Arial Bold font
c.xAxis().setLabelStyle("arialbd.ttf")
c.yAxis().setLabelStyle("arialbd.ttf")
# When auto-scaling, use tick spacing of 40 pixels as a guideline
c.yAxis().setTickDensity(40)
c.xAxis().setTickDensity(40)
# Add a contour layer using the given data
layer = c.addContourLayer(dataX, dataY, dataZ)
# Set the contour color to transparent
layer.setContourColor(ChartDirector::Transparent)
# Move the grid lines in front of the contour layer
c.getPlotArea().moveGridBefore(layer)
# Add a color axis (the legend) in which the left center point is anchored at (495, 240).
# Set the length to 370 pixels and the labels on the right side.
cAxis = layer.setColorAxis(495, 240, ChartDirector::Left, 370, ChartDirector::Right)
# Add a bounding box to the color axis using light grey (eeeeee) as the background and dark
# grey (444444) as the border.
cAxis.setBoundingBox(0xeeeeee, 0x444444)
# Add a title to the color axis using 12 points Arial Bold Italic font
cAxis.setTitle("Twist Pressure (Twist-Volt)", "arialbi.ttf", 12)
# Set color axis labels to use Arial Bold font
cAxis.setLabelStyle("arialbd.ttf")
# Use smooth gradient coloring
cAxis.setColorGradient(true)
# Output the chart
send_data(c.makeChart2(ChartDirector::JPG), :type => "image/jpeg", :disposition => "inline")
end
end |