ChartDirector 6.0 (Ruby Edition)

Surface Chart Axis Types


The example demonstrates different axis scale types for the surface charts.

Like an XYChart, in a SurfaceChart, the axis scale can represent numbers, date/time or labels. In this example, the x-axis uses a date/time scale, the y-axis uses a label based scale, and the z-axis uses a numeric scale.

Source Code Listing

[Ruby On Rails Version - Controller] app/controllers/surfaceaxis_controller.rb
require("chartdirector")

class SurfaceaxisController < ApplicationController

    def index()
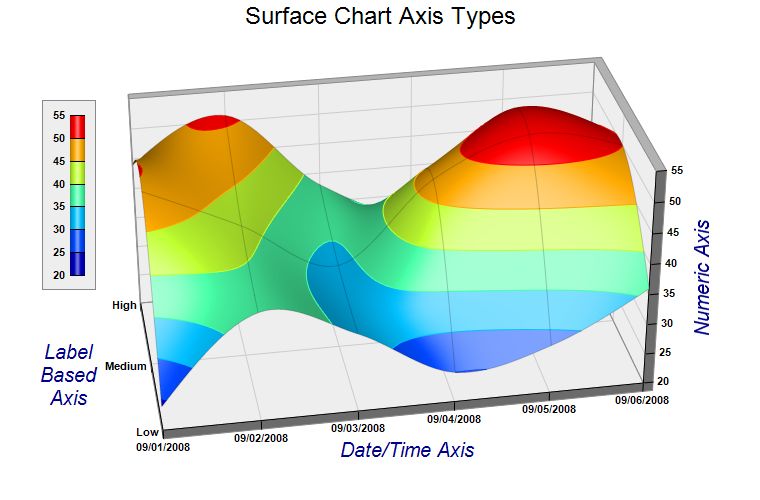
        @title = "Surface Chart Axis Types"
        @ctrl_file = File.expand_path(__FILE__)
        @noOfCharts = 1
        render :template => "templates/chartview"
    end

    #
    # Render and deliver the chart
    #
    def getchart()
        # The x and y coordinates of the grid
        dataX = [Time.mktime(2008, 9, 1), Time.mktime(2008, 9, 2), Time.mktime(2008, 9, 3),
            Time.mktime(2008, 9, 4), Time.mktime(2008, 9, 5), Time.mktime(2008, 9, 6)]
        dataY = ["Low", "Medium", "High"]

        # The data series
        lowData = [24, 38, 33, 25, 28, 36]
        mediumData = [49, 42, 34, 47, 53, 50]
        highData = [44, 51, 38, 33, 47, 42]

        # Create a SurfaceChart object of size 760 x 500 pixels
        c = ChartDirector::SurfaceChart.new(760, 500)

        # Add a title to the chart using 18 points Arial font
        c.addTitle("Surface Chart Axis Types", "arial.ttf", 18)

        # Set the center of the plot region at (385, 240), and set width x depth x height to 480 x
        # 240 x 240 pixels
        c.setPlotRegion(385, 240, 480, 240, 240)

        # Set the elevation and rotation angles to 30 and -10 degrees
        c.setViewAngle(30, -10)

        # Set the data to use to plot the chart. As the y-data are text strings (enumerated), we
        # will use an empty array for the y-coordinates. For the z data series, they are just the
        # concatenation of the individual data series.
        c.setData(dataX, nil, ChartDirector::ArrayMath.new(lowData).insert(mediumData).insert(
            highData).result())

        # Set the y-axis labels
        c.yAxis().setLabels(dataY)

        # Set x-axis tick density to 75 pixels. ChartDirector auto-scaling will use this as the
        # guideline when putting ticks on the x-axis.
        c.xAxis().setTickDensity(75)

        # Spline interpolate data to a 80 x 40 grid for a smooth surface
        c.setInterpolation(80, 40)

        # Set surface grid lines to semi-transparent black (cc000000).
        c.setSurfaceAxisGrid(0xcc000000)

        # Set contour lines to the same color as the fill color at the contour level
        c.setContourColor(ChartDirector::SameAsMainColor)

        # Add a color axis (the legend) in which the top right corner is anchored at (95, 100). Set
        # the length to 160 pixels and the labels on the left side.
        cAxis = c.setColorAxis(95, 100, ChartDirector::TopRight, 160, ChartDirector::Left)

        # Add a bounding box with light grey (eeeeee) background and grey (888888) border.
        cAxis.setBoundingBox(0xeeeeee, 0x888888)

        # Set label style to Arial bold for all axes
        c.xAxis().setLabelStyle("arialbd.ttf")
        c.yAxis().setLabelStyle("arialbd.ttf")
        c.zAxis().setLabelStyle("arialbd.ttf")
        c.colorAxis().setLabelStyle("arialbd.ttf")

        # Set the x, y and z axis titles using deep blue (000088) 15 points Arial font
        c.xAxis().setTitle("Date/Time Axis", "ariali.ttf", 15, 0x000088)
        c.yAxis().setTitle("Label\nBased\nAxis", "ariali.ttf", 15, 0x000088)
        c.zAxis().setTitle("Numeric Axis", "ariali.ttf", 15, 0x000088)

        # Output the chart
        send_data(c.makeChart2(ChartDirector::JPG), :type => "image/jpeg", :disposition => "inline")

    end

end

[Ruby On Rails Version - View] app/views/templates/chartview.html.erb
<html>
<body style="margin:5px 0px 0px 5px">

<!-- Title -->
<div style="font-size:18pt; font-family:verdana; font-weight:bold">
    <%= @title %>
</div>
<hr style="border:solid 1px #000080" />

<!-- Source Code Listing Link -->
<div style="font-size:9pt; font-family:verdana; margin-bottom:1.5em">
    <%= link_to "Source Code Listing", 
        :controller => "cddemo", :action => "viewsource",
        :ctrl_file => @ctrl_file, :view_file => File.expand_path(__FILE__) %>
</div>

<!-- Create one or more IMG tags to display the demo chart(s) -->
<% 0.upto(@noOfCharts - 1) do |i| %>
    <img src="<%= url_for(:action => "getchart", :img => i) %>">
<% end %>

</body>
</html>

[Command Line Version] rubydemo/surfaceaxis.rb
#!/usr/bin/env ruby
require("chartdirector")

# The x and y coordinates of the grid
dataX = [Time.mktime(2008, 9, 1), Time.mktime(2008, 9, 2), Time.mktime(2008, 9, 3), Time.mktime(
    2008, 9, 4), Time.mktime(2008, 9, 5), Time.mktime(2008, 9, 6)]
dataY = ["Low", "Medium", "High"]

# The data series
lowData = [24, 38, 33, 25, 28, 36]
mediumData = [49, 42, 34, 47, 53, 50]
highData = [44, 51, 38, 33, 47, 42]

# Create a SurfaceChart object of size 760 x 500 pixels
c = ChartDirector::SurfaceChart.new(760, 500)

# Add a title to the chart using 18 points Arial font
c.addTitle("Surface Chart Axis Types", "arial.ttf", 18)

# Set the center of the plot region at (385, 240), and set width x depth x height to 480 x 240 x 240
# pixels
c.setPlotRegion(385, 240, 480, 240, 240)

# Set the elevation and rotation angles to 30 and -10 degrees
c.setViewAngle(30, -10)

# Set the data to use to plot the chart. As the y-data are text strings (enumerated), we will use an
# empty array for the y-coordinates. For the z data series, they are just the concatenation of the
# individual data series.
c.setData(dataX, nil, ChartDirector::ArrayMath.new(lowData).insert(mediumData).insert(highData
    ).result())

# Set the y-axis labels
c.yAxis().setLabels(dataY)

# Set x-axis tick density to 75 pixels. ChartDirector auto-scaling will use this as the guideline
# when putting ticks on the x-axis.
c.xAxis().setTickDensity(75)

# Spline interpolate data to a 80 x 40 grid for a smooth surface
c.setInterpolation(80, 40)

# Set surface grid lines to semi-transparent black (cc000000).
c.setSurfaceAxisGrid(0xcc000000)

# Set contour lines to the same color as the fill color at the contour level
c.setContourColor(ChartDirector::SameAsMainColor)

# Add a color axis (the legend) in which the top right corner is anchored at (95, 100). Set the
# length to 160 pixels and the labels on the left side.
cAxis = c.setColorAxis(95, 100, ChartDirector::TopRight, 160, ChartDirector::Left)

# Add a bounding box with light grey (eeeeee) background and grey (888888) border.
cAxis.setBoundingBox(0xeeeeee, 0x888888)

# Set label style to Arial bold for all axes
c.xAxis().setLabelStyle("arialbd.ttf")
c.yAxis().setLabelStyle("arialbd.ttf")
c.zAxis().setLabelStyle("arialbd.ttf")
c.colorAxis().setLabelStyle("arialbd.ttf")

# Set the x, y and z axis titles using deep blue (000088) 15 points Arial font
c.xAxis().setTitle("Date/Time Axis", "ariali.ttf", 15, 0x000088)
c.yAxis().setTitle("Label\nBased\nAxis", "ariali.ttf", 15, 0x000088)
c.zAxis().setTitle("Numeric Axis", "ariali.ttf", 15, 0x000088)

# Output the chart
c.makeChart("surfaceaxis.jpg")