This example demonstrates a 3D area chart configured using Layer.set3D.
ChartDirector 6.0 (Ruby Edition)
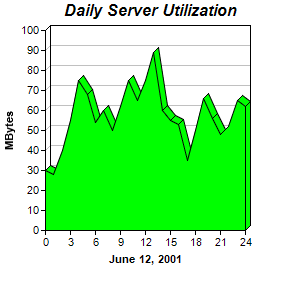
3D Area Chart
Source Code Listing
require("chartdirector")

class ThreedareaController < ApplicationController

    def index()
        @title = "3D Area Chart"
        @ctrl_file = File.expand_path(__FILE__)
        @noOfCharts = 1
        render :template => "templates/chartview"
    end

    #
    # Render and deliver the chart
    #
    def getchart()
        # The data for the area chart
        data = [30, 28, 40, 55, 75, 68, 54, 60, 50, 62, 75, 65, 75, 89, 60, 55, 53, 35, 50, 66, 56,
            48, 52, 65, 62]

        # The labels for the area chart
        labels = ["0", "1", "2", "3", "4", "5", "6", "7", "8", "9", "10", "11", "12", "13", "14",
            "15", "16", "17", "18", "19", "20", "21", "22", "23", "24"]

        # Create a XYChart object of size 300 x 300 pixels
        c = ChartDirector::XYChart.new(300, 300)

        # Set the plotarea at (45, 30) and of size 200 x 200 pixels
        c.setPlotArea(45, 30, 200, 200)

        # Add a title to the chart using 12pt Arial Bold Italic font
        c.addTitle("Daily Server Utilization", "arialbi.ttf", 12)

        # Add a title to the y axis
        c.yAxis().setTitle("MBytes")

        # Add a title to the x axis
        c.xAxis().setTitle("June 12, 2001")

        # Add a green (0x00ff00) 3D area chart layer using the give data
        c.addAreaLayer(data, 0x00ff00).set3D()

        # Set the labels on the x axis.
        c.xAxis().setLabels(labels)

        # Display 1 out of 3 labels on the x-axis.
        c.xAxis().setLabelStep(3)

        # Output the chart
        send_data(c.makeChart2(ChartDirector::PNG), :type => "image/png", :disposition => "inline")

    end

end |
<html>
<body style="margin:5px 0px 0px 5px">

<!-- Title -->
<div style="font-size:18pt; font-family:verdana; font-weight:bold">
    <%= @title %>
</div>
<hr style="border:solid 1px #000080" />

<!-- Source Code Listing Link -->
<div style="font-size:9pt; font-family:verdana; margin-bottom:1.5em">
    <%= link_to "Source Code Listing",
        :controller => "cddemo", :action => "viewsource",
        :ctrl_file => @ctrl_file, :view_file => File.expand_path(__FILE__) %>
</div>

<!-- Create one or more IMG tags to display the demo chart(s) -->
<% 0.upto(@noOfCharts - 1) do |i| %>
    <img src="<%= url_for(:action => "getchart", :img => i) %>">
<% end %>

</body>
</html> |
#!/usr/bin/env ruby
require("chartdirector")

# The data for the area chart
data = [30, 28, 40, 55, 75, 68, 54, 60, 50, 62, 75, 65, 75, 89, 60, 55, 53, 35, 50, 66, 56, 48, 52,
    65, 62]

# The labels for the area chart
labels = ["0", "1", "2", "3", "4", "5", "6", "7", "8", "9", "10", "11", "12", "13", "14", "15",
    "16", "17", "18", "19", "20", "21", "22", "23", "24"]

# Create a XYChart object of size 300 x 300 pixels
c = ChartDirector::XYChart.new(300, 300)

# Set the plotarea at (45, 30) and of size 200 x 200 pixels
c.setPlotArea(45, 30, 200, 200)

# Add a title to the chart using 12pt Arial Bold Italic font
c.addTitle("Daily Server Utilization", "arialbi.ttf", 12)

# Add a title to the y axis
c.yAxis().setTitle("MBytes")

# Add a title to the x axis
c.xAxis().setTitle("June 12, 2001")

# Add a green (0x00ff00) 3D area chart layer using the give data
c.addAreaLayer(data, 0x00ff00).set3D()

# Set the labels on the x axis.
c.xAxis().setLabels(labels)

# Display 1 out of 3 labels on the x-axis.
c.xAxis().setLabelStep(3)

# Output the chart
c.makeChart("threedarea.png") |