ChartDirector 6.0 (Ruby Edition)

3D Scatter Chart (2)


This example extends the 3D Scatter Chart (1) example by including drop lines, using alternative view angles and continuous coloring.

Drop lines are lines that drop from the data points to the XY plane. They help to visualize the "height" (the z-coordinate) of the points and can be useful if there are not too many data points.

Source Code Listing

[Ruby On Rails Version - Controller] app/controllers/threedscatter2_controller.rb
require("chartdirector")

class Threedscatter2Controller < ApplicationController

    def index()
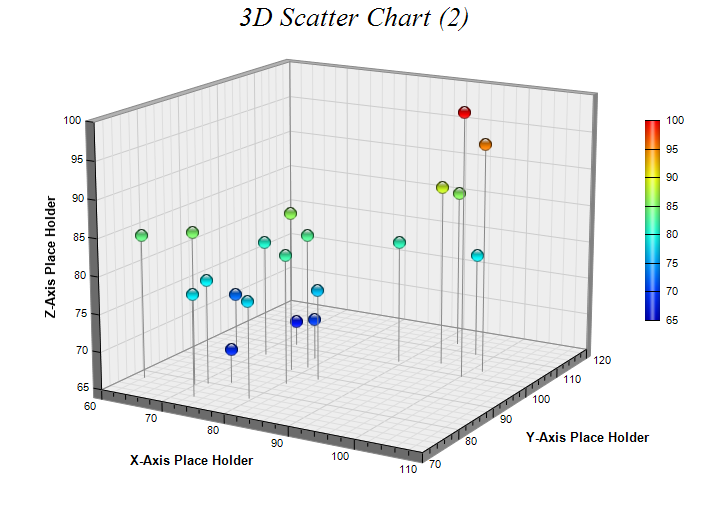
        @title = "3D Scatter Chart (2)"
        @ctrl_file = File.expand_path(__FILE__)
        @noOfCharts = 1
        render :template => "templates/chartview"
    end

    #
    # Render and deliver the chart
    #
    def getchart()
        # The XYZ data for the 3D scatter chart as 3 random data series
        r = ChartDirector::RanSeries.new(3)
        xData = r.getSeries2(20, 100, -10, 10)
        yData = r.getSeries2(20, 100, -10, 10)
        zData = r.getSeries2(20, 100, -10, 10)

        # Create a ThreeDScatterChart object of size 720 x 520 pixels
        c = ChartDirector::ThreeDScatterChart.new(720, 520)

        # Add a title to the chart using 20 points Times New Roman Italic font
        c.addTitle("3D Scatter Chart (2)  ", "timesi.ttf", 20)

        # Set the center of the plot region at (350, 240), and set width x depth x height to 360 x
        # 360 x 270 pixels
        c.setPlotRegion(350, 240, 360, 360, 270)

        # Set the elevation and rotation angles to 15 and 30 degrees
        c.setViewAngle(15, 30)

        # Add a scatter group to the chart using 13 pixels glass sphere symbols, in which the color
        # depends on the z value of the symbol
        g = c.addScatterGroup(xData, yData, zData, "", ChartDirector::GlassSphere2Shape, 13,
            ChartDirector::SameAsMainColor)

        # Add grey (888888) drop lines to the symbols
        g.setDropLine(0x888888)

        # Add a color axis (the legend) in which the left center is anchored at (645, 220). Set the
        # length to 200 pixels and the labels on the right side. Use smooth gradient coloring.
        c.setColorAxis(645, 220, ChartDirector::Left, 200, ChartDirector::Right).setColorGradient()

        # Set the x, y and z axis titles using 10 points Arial Bold font
        c.xAxis().setTitle("X-Axis Place Holder", "arialbd.ttf", 10)
        c.yAxis().setTitle("Y-Axis Place Holder", "arialbd.ttf", 10)
        c.zAxis().setTitle("Z-Axis Place Holder", "arialbd.ttf", 10)

        # Output the chart
        send_data(c.makeChart2(ChartDirector::PNG), :type => "image/png", :disposition => "inline")

    end

end

[Ruby On Rails Version - View] app/views/templates/chartview.html.erb
<html>
<body style="margin:5px 0px 0px 5px">

<!-- Title -->
<div style="font-size:18pt; font-family:verdana; font-weight:bold">
    <%= @title %>
</div>
<hr style="border:solid 1px #000080" />

<!-- Source Code Listing Link -->
<div style="font-size:9pt; font-family:verdana; margin-bottom:1.5em">
    <%= link_to "Source Code Listing", 
        :controller => "cddemo", :action => "viewsource",
        :ctrl_file => @ctrl_file, :view_file => File.expand_path(__FILE__) %>
</div>

<!-- Create one or more IMG tags to display the demo chart(s) -->
<% 0.upto(@noOfCharts - 1) do |i| %>
    <img src="<%= url_for(:action => "getchart", :img => i) %>">
<% end %>

</body>
</html>

[Command Line Version] rubydemo/threedscatter2.rb
#!/usr/bin/env ruby
require("chartdirector")

# The XYZ data for the 3D scatter chart as 3 random data series
r = ChartDirector::RanSeries.new(3)
xData = r.getSeries2(20, 100, -10, 10)
yData = r.getSeries2(20, 100, -10, 10)
zData = r.getSeries2(20, 100, -10, 10)

# Create a ThreeDScatterChart object of size 720 x 520 pixels
c = ChartDirector::ThreeDScatterChart.new(720, 520)

# Add a title to the chart using 20 points Times New Roman Italic font
c.addTitle("3D Scatter Chart (2)  ", "timesi.ttf", 20)

# Set the center of the plot region at (350, 240), and set width x depth x height to 360 x 360 x 270
# pixels
c.setPlotRegion(350, 240, 360, 360, 270)

# Set the elevation and rotation angles to 15 and 30 degrees
c.setViewAngle(15, 30)

# Add a scatter group to the chart using 13 pixels glass sphere symbols, in which the color depends
# on the z value of the symbol
g = c.addScatterGroup(xData, yData, zData, "", ChartDirector::GlassSphere2Shape, 13,
    ChartDirector::SameAsMainColor)

# Add grey (888888) drop lines to the symbols
g.setDropLine(0x888888)

# Add a color axis (the legend) in which the left center is anchored at (645, 220). Set the length
# to 200 pixels and the labels on the right side. Use smooth gradient coloring.
c.setColorAxis(645, 220, ChartDirector::Left, 200, ChartDirector::Right).setColorGradient()

# Set the x, y and z axis titles using 10 points Arial Bold font
c.xAxis().setTitle("X-Axis Place Holder", "arialbd.ttf", 10)
c.yAxis().setTitle("Y-Axis Place Holder", "arialbd.ttf", 10)
c.zAxis().setTitle("Z-Axis Place Holder", "arialbd.ttf", 10)

# Output the chart
c.makeChart("threedscatter2.png")