ChartDirector 6.0 (Ruby Edition)

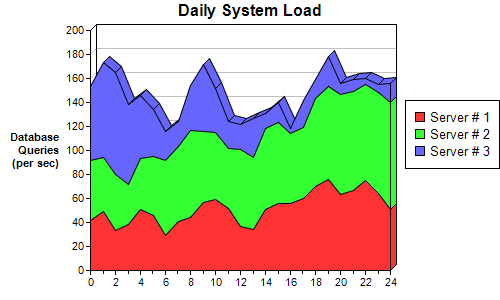
3D Stacked Area Chart


This example demonstrates creating a stacked area chart with 3D effects.

The key features demonstrated in this example are:

Source Code Listing

[Ruby On Rails Version - Controller] app/controllers/threedstackarea_controller.rb
require("chartdirector")

class ThreedstackareaController < ApplicationController

    def index()
        @title = "3D Stacked Area Chart"
        @ctrl_file = File.expand_path(__FILE__)
        @noOfCharts = 1
        render :template => "templates/chartview"
    end

    #
    # Render and deliver the chart
    #
    def getchart()
        # The data for the area chart
        data0 = [42, 49, 33, 38, 51, 46, 29, 41, 44, 57, 59, 52, 37, 34, 51, 56, 56, 60, 70, 76, 63,
            67, 75, 64, 51]
        data1 = [50, 45, 47, 34, 42, 49, 63, 62, 73, 59, 56, 50, 64, 60, 67, 67, 58, 59, 73, 77, 84,
            82, 80, 84, 89]
        data2 = [61, 79, 85, 66, 53, 39, 24, 21, 37, 56, 37, 22, 21, 33, 13, 17, 4, 23, 16, 25, 9,
            10, 5, 7, 16]
        labels = ["0", "1", "2", "3", "4", "5", "6", "7", "8", "9", "10", "11", "12", "13", "14",
            "15", "16", "17", "18", "19", "20", "21", "22", "23", "24"]

        # Create a XYChart object of size 500 x 300 pixels
        c = ChartDirector::XYChart.new(500, 300)

        # Set the plotarea at (90, 30) and of size 300 x 240 pixels.
        c.setPlotArea(90, 30, 300, 240)

        # Add a legend box at (405, 100)
        c.addLegend(405, 100)

        # Add a title to the chart
        c.addTitle("Daily System Load")

        # Add a title to the y axis. Draw the title upright (font angle = 0)
        c.yAxis().setTitle("Database\nQueries\n(per sec)").setFontAngle(0)

        # Set the labels on the x axis.
        c.xAxis().setLabels(labels)

        # Display 1 out of 2 labels on the x-axis. Show minor ticks for remaining labels.
        c.xAxis().setLabelStep(2, 1)

        # Add an area layer
        layer = c.addAreaLayer()

        # Draw the area layer in 3D
        layer.set3D()

        # Add the three data sets to the area layer
        layer.addDataSet(data0, -1, "Server # 1")
        layer.addDataSet(data1, -1, "Server # 2")
        layer.addDataSet(data2, -1, "Server # 3")

        # Output the chart
        send_data(c.makeChart2(ChartDirector::PNG), :type => "image/png", :disposition => "inline")

    end

end

[Ruby On Rails Version - View] app/views/templates/chartview.html.erb
<html>
<body style="margin:5px 0px 0px 5px">

<!-- Title -->
<div style="font-size:18pt; font-family:verdana; font-weight:bold">
    <%= @title %>
</div>
<hr style="border:solid 1px #000080" />

<!-- Source Code Listing Link -->
<div style="font-size:9pt; font-family:verdana; margin-bottom:1.5em">
    <%= link_to "Source Code Listing", 
        :controller => "cddemo", :action => "viewsource",
        :ctrl_file => @ctrl_file, :view_file => File.expand_path(__FILE__) %>
</div>

<!-- Create one or more IMG tags to display the demo chart(s) -->
<% 0.upto(@noOfCharts - 1) do |i| %>
    <img src="<%= url_for(:action => "getchart", :img => i) %>">
<% end %>

</body>
</html>

[Command Line Version] rubydemo/threedstackarea.rb
#!/usr/bin/env ruby
require("chartdirector")

# The data for the area chart
data0 = [42, 49, 33, 38, 51, 46, 29, 41, 44, 57, 59, 52, 37, 34, 51, 56, 56, 60, 70, 76, 63, 67, 75,
    64, 51]
data1 = [50, 45, 47, 34, 42, 49, 63, 62, 73, 59, 56, 50, 64, 60, 67, 67, 58, 59, 73, 77, 84, 82, 80,
    84, 89]
data2 = [61, 79, 85, 66, 53, 39, 24, 21, 37, 56, 37, 22, 21, 33, 13, 17, 4, 23, 16, 25, 9, 10, 5, 7,
    16]
labels = ["0", "1", "2", "3", "4", "5", "6", "7", "8", "9", "10", "11", "12", "13", "14", "15",
    "16", "17", "18", "19", "20", "21", "22", "23", "24"]

# Create a XYChart object of size 500 x 300 pixels
c = ChartDirector::XYChart.new(500, 300)

# Set the plotarea at (90, 30) and of size 300 x 240 pixels.
c.setPlotArea(90, 30, 300, 240)

# Add a legend box at (405, 100)
c.addLegend(405, 100)

# Add a title to the chart
c.addTitle("Daily System Load")

# Add a title to the y axis. Draw the title upright (font angle = 0)
c.yAxis().setTitle("Database\nQueries\n(per sec)").setFontAngle(0)

# Set the labels on the x axis.
c.xAxis().setLabels(labels)

# Display 1 out of 2 labels on the x-axis. Show minor ticks for remaining labels.
c.xAxis().setLabelStep(2, 1)

# Add an area layer
layer = c.addAreaLayer()

# Draw the area layer in 3D
layer.set3D()

# Add the three data sets to the area layer
layer.addDataSet(data0, -1, "Server # 1")
layer.addDataSet(data1, -1, "Server # 2")
layer.addDataSet(data2, -1, "Server # 3")

# Output the chart
c.makeChart("threedstackarea.png")