This sample program demonstrates a track cursor programmed with the following features:
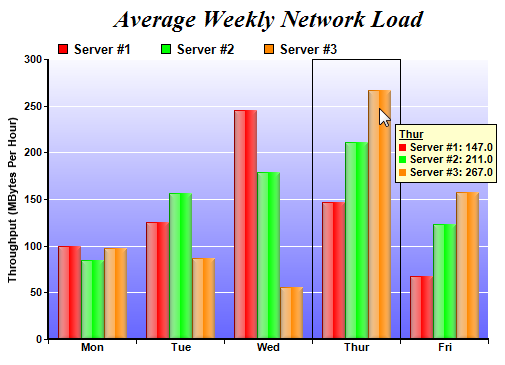
- A box that horizontally centers around the x data value nearest to the mouse cursor.
- A floating legend box that moves with the mouse cursor, displaying the data values at the x data value nearest to the mouse cursor.
The trackBoxLegend Javascript function is the routine that draws the track cursor. Its key elements are:
The trackBoxLegend Javascript function is the routine that draws the track cursor. Its key elements are:
- The code first uses JsChartViewer.hideObj to clear the previous track cursor, if any.
- The nearest x data value is obtained using JsXYChart.getNearestXValue.
- The code draws a rectangle that horizontally spans from (x - 0.5) to (x + 0.5) with JsChartViewer.showTextBox. The +/- 0.5 offset is the suitable value to use for a label based x-axis (that is, for axis set up with Axis.setLabels or Axis.setLabels2). For this type of axis, the label distance is assumed to be 1 x-axis unit irrespective of what are the labels, so an offset of 0.5 refers to the middle position between two labels.
- The code then iterates through all data sets in all layers to find all the data points at the nearest x data value. For each of these points, it formats a legend entry for the point, which consists of a colored square as the icon (creating using JsChartViewer.htmlRect), data set name (obtained using JsDataSet.getDataName), and the data value (obtained using JsDataSet.getValue).
- Finally, the code combines all the legend entries into a legend box and draws it near the mouse cursor using JsChartViewer.showTextBox.