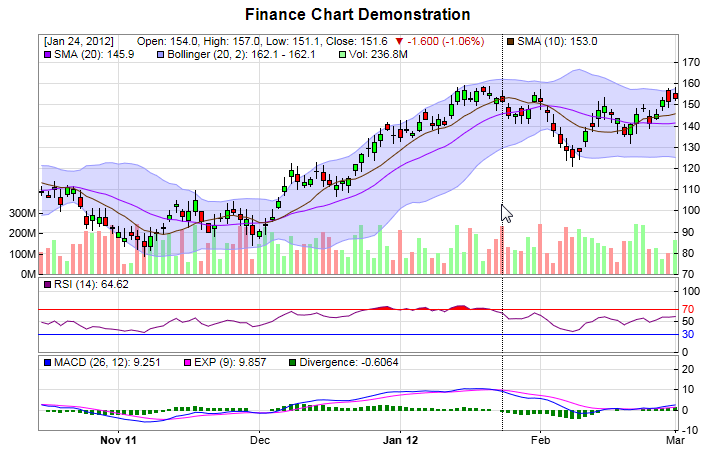
This sample program demonstrates a track cursor for a finance chart programmed with the following features:
- A vertical line that follows the mouse cursor on the plot area and snaps to the nearest trading session.
- Dynamically updated legend entries that shows the price, volume and other technical indicator for the nearest trading session.
On the browser side, in the window onload event handler, Javascript is used to set up the event handler for the MouseMovePlotArea, TouchStartPlotArea, TouchMovePlotArea , ChartMove and Now events. The event handler calls trackFinance to draw the track cursor.
The trackFinance Javascript function is the routine that draws the track cursor. Its key elements are:
- The code first uses JsChartViewer.hideObj to clear the previous track cursor, if any.
- The nearest trading session is obtained from the first JsXYChart in the FinanceChart using JsXYChart.getNearestXValue.
- The code iterates through all the JsXYChart objects in the FinanceChart. For each JsXYChart, the code iterates through all the layers to create dynamic legend entries. The FinanceChart creates default static legend entries for all indicators showing their latest values (even though the default static legend box is set to transparent in the chart). The code creates the dynamic legend entries by replacing the values in the static legend entries.
- If a layer contains 4 data sets, the code assumes it is either a CandleStickLayer or HLOCLayer. It formats a legend entry consisting of the open, high, low, close values, as well as an up/down icon and the percentage change.
- If a layer contains 2 data sets, the code assumes the layer is for a "band" or "channel" (such as Bollinger Band or Donchian Channel). The code formats a legend entry by replacing the values in the default legend entry (obtained using JsDataSet.getDataName).
- If a layer contains 3 data sets, the code assumes the layer is for volume bars, with the 3 data sets representing volume bars of different colors for up, down and flat days. The code computes the volume by adding the values from the three data sets, and formats a legend entry by replacing the value in the default legend entry (obtained using JsDataSet.getDataName) with the computed value.
- In all other cases, the code iterates the data sets. For each of them, it formats a legend by replacing the value in the default legend entry (obtained using JsDataSet.getDataName) with the value for the nearest trading session (obtained using JsDataSet.getValue).
- Finally, the code combines all the legend entries into a legend box and draws it on top of the plot area using JsChartViewer.showTextBox. It also draws a vertical line at the nearest trading session using JsChartViewer.drawVLine.