[Qt Widgets version] qtdemo/realtimemultichart.cpp
#include <QApplication>
#include <QIcon>
#include <QPushButton>
#include <QFileDialog>
#include "realtimemultichart.h"
#include "chartdir.h"
#include <math.h>
#include <vector>
#include <sstream>
//
// In this example, a 250ms timer is used to obtain real-time data.
//
static const int DataInterval = 250;
//
// The height of each XYChart. The bottom chart has an extra height for the x-axis labels.
//
static const int chartHeight = 120;
static const int xAxisHeight = 25;
//
// Constructor
//
RealTimeMultiChart::RealTimeMultiChart(QWidget *parent) :
QDialog(parent)
{
//
// Set up the GUI
//
setFixedSize(772, 60 + 3 * chartHeight + xAxisHeight);
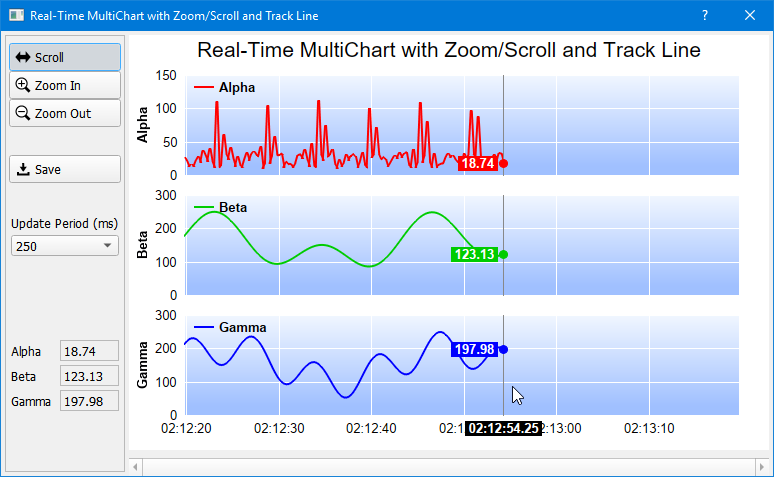
setWindowTitle("Real-Time MultiChart with Zoom/Scroll and Track Line");
QFrame *frame = new QFrame(this);
frame->setGeometry(4, 4, 120, height() - 8);
frame->setFrameShape(QFrame::StyledPanel);
// Pointer push button
QPushButton *pointerPB = new QPushButton(QIcon(":/icons/scroll_icon.png"), "Scroll", frame);
pointerPB->setGeometry(4, 8, 112, 28);
pointerPB->setStyleSheet("QPushButton { text-align:left; padding:5px}");
pointerPB->setCheckable(true);
// Zoom In push button
QPushButton *zoomInPB = new QPushButton(QIcon(":/icons/zoomin_icon.png"), "Zoom In", frame);
zoomInPB->setGeometry(4, 36, 112, 28);
zoomInPB->setStyleSheet("QPushButton { text-align:left; padding:5px}");
zoomInPB->setCheckable(true);
// Zoom Out push button
QPushButton *zoomOutPB = new QPushButton(QIcon(":/icons/zoomout_icon.png"), "Zoom Out", frame);
zoomOutPB->setGeometry(4, 64, 112, 28);
zoomOutPB->setStyleSheet("QPushButton { text-align:left; padding:5px}");
zoomOutPB->setCheckable(true);
// Save push button
QPushButton *savePB = new QPushButton(QIcon(":/icons/save_icon.png"), "Save", frame);
savePB->setStyleSheet("QPushButton { text-align:left; padding:5px}");
savePB->setGeometry(4, 120, 112, 28);
connect(savePB, SIGNAL(clicked(bool)), SLOT(onSave(bool)));
// The Pointer/Zoom In/Zoom Out buttons form a button group
mouseUsage = new QButtonGroup(frame);
mouseUsage->addButton(pointerPB, Chart::MouseUsageScroll);
mouseUsage->addButton(zoomInPB, Chart::MouseUsageZoomIn);
mouseUsage->addButton(zoomOutPB, Chart::MouseUsageZoomOut);
connect(mouseUsage, SIGNAL(buttonPressed(QAbstractButton*)),
SLOT(onMouseUsageChanged(QAbstractButton*)));
// Update Period drop down list box
(new QLabel("Update Period (ms)", frame))->setGeometry(6, 180, 108, 16);
updatePeriod = new QComboBox(frame);
updatePeriod->setGeometry(6, 200, 108, 21);
updatePeriod->addItems(QStringList() << "250" << "500" << "750" << "1000" << "1250" << "1500"
<< "1750" << "2000");
connect(updatePeriod, SIGNAL(currentIndexChanged(int)), SLOT(onUpdatePeriodChanged(int)));
// Alpha Value display
(new QLabel("Alpha", frame))->setGeometry(6, height() - 140, 48, 21);
m_ValueA = new QLabel(frame);
m_ValueA->setGeometry(55, height() - 140, 59, 21);
m_ValueA->setFrameShape(QFrame::StyledPanel);
// Beta Value display
(new QLabel("Beta", frame))->setGeometry(6, height() - 115, 48, 21);
m_ValueB = new QLabel(frame);
m_ValueB->setGeometry(55, height() - 115, 59, 21);
m_ValueB->setFrameShape(QFrame::StyledPanel);
// Gamma Value display
(new QLabel("Gamma", frame))->setGeometry(6, height() - 90, 48, 21);
m_ValueC = new QLabel(frame);
m_ValueC->setGeometry(55, height() - 90, 59, 21);
m_ValueC->setFrameShape(QFrame::StyledPanel);
// Chart Viewer
m_ChartViewer = new QChartViewer(this);
m_ChartViewer->setGeometry(128, 4, 640, 350);
connect(m_ChartViewer, SIGNAL(viewPortChanged()), SLOT(onViewPortChanged()));
connect(m_ChartViewer, SIGNAL(mouseMovePlotArea(QMouseEvent*)),
SLOT(onMouseMovePlotArea(QMouseEvent*)));
// Horizontal scroll bar
m_HScrollBar = new QScrollBar(Qt::Horizontal, this);
m_HScrollBar->setGeometry(128, height() - 18, 640, 18);
connect(m_HScrollBar, SIGNAL(valueChanged(int)), SLOT(onHScrollBarChanged(int)));
// Clear data arrays to Chart::NoValue
for (int i = 0; i < sampleSize; ++i)
m_timeStamps[i] = m_dataSeriesA[i] = m_dataSeriesB[i] = m_dataSeriesC[i] = Chart::NoValue;
m_currentIndex = 0;
// Set m_nextDataTime to the current time. It is used by the real time random number
// generator so it knows what timestamp should be used for the next data point.
m_nextDataTime = QDateTime::currentDateTime();
// Initially set the mouse to drag to scroll mode.
pointerPB->click();
// Enable mouse wheel zooming by setting the zoom ratio to 1.1 per wheel event
m_ChartViewer->setMouseWheelZoomRatio(1.1);
// Set up the data acquisition mechanism. In this demo, we just use a timer to get a
// sample every 250ms.
QTimer *dataRateTimer = new QTimer(this);
dataRateTimer->start(DataInterval);
connect(dataRateTimer, SIGNAL(timeout()), SLOT(onDataTimer()));
// Set up the chart update timer
m_ChartUpdateTimer = new QTimer(this);
connect(m_ChartUpdateTimer, SIGNAL(timeout()), SLOT(onChartUpdateTimer()));
// Can start now
m_ChartUpdateTimer->start();
}
RealTimeMultiChart::~RealTimeMultiChart()
{
deleteMultiChart((MultiChart*)m_ChartViewer->getChart());
}
//
// The Pointer, Zoom In or Zoom out button is pressed
//
void RealTimeMultiChart::onMouseUsageChanged(QAbstractButton *b)
{
m_ChartViewer->setMouseUsage(mouseUsage->id(b));
}
//
// The Save button is pressed
//
void RealTimeMultiChart::onSave(bool)
{
QString fileName = QFileDialog::getSaveFileName(this, "Save", "chartdirector_demo",
"PNG (*.png);;JPG (*.jpg);;GIF (*.gif);;BMP (*.bmp);;SVG (*.svg);;PDF (*.pdf)");
if (!fileName.isEmpty())
{
// Save the chart
BaseChart *c = m_ChartViewer->getChart();
if (0 != c)
c->makeChart(fileName.toUtf8().constData());
}
}
//
// User changes the chart update period
//
void RealTimeMultiChart::onUpdatePeriodChanged(int)
{
m_ChartUpdateTimer->start(updatePeriod->currentText().toInt());
}
//
// The data acquisition routine. In this demo, this is invoked every 250ms.
//
void RealTimeMultiChart::onDataTimer()
{
// The current time
QDateTime now = QDateTime::currentDateTime();
// This is our formula for the random number generator
do
{
// We need the currentTime in millisecond resolution
qint64 t = m_nextDataTime.toMSecsSinceEpoch();
double currentTime = Chart::chartTime2((int)(t / 1000)) + (t % 1000) / 250 * 0.25;
// Get a data sample
double p = currentTime * 4;
double dataA = 20 + cos(p * 129241) * 10 + 1 / (cos(p) * cos(p) + 0.01);
double dataB = 150 + 100 * sin(p / 27.7) * sin(p / 10.1);
double dataC = 150 + 100 * cos(p / 6.7) * cos(p / 11.9);
// In this demo, if the data arrays are full, the oldest 5% of data are discarded.
if (m_currentIndex >= sampleSize)
{
m_currentIndex = sampleSize * 95 / 100 - 1;
for(int i = 0; i < m_currentIndex; ++i)
{
int srcIndex = i + sampleSize - m_currentIndex;
m_timeStamps[i] = m_timeStamps[srcIndex];
m_dataSeriesA[i] = m_dataSeriesA[srcIndex];
m_dataSeriesB[i] = m_dataSeriesB[srcIndex];
m_dataSeriesC[i] = m_dataSeriesC[srcIndex];
}
}
// Store the new values in the current index position, and increment the index.
m_timeStamps[m_currentIndex] = currentTime;
m_dataSeriesA[m_currentIndex] = dataA;
m_dataSeriesB[m_currentIndex] = dataB;
m_dataSeriesC[m_currentIndex] = dataC;
++m_currentIndex;
m_nextDataTime = m_nextDataTime.addMSecs(DataInterval);
}
while (m_nextDataTime < now);
//
// We provide some visual feedback to the latest numbers generated, so you can see the
// data being generated.
//
m_ValueA->setText(QString::number(m_dataSeriesA[m_currentIndex - 1], 'f', 2));
m_ValueB->setText(QString::number(m_dataSeriesB[m_currentIndex - 1], 'f', 2));
m_ValueC->setText(QString::number(m_dataSeriesC[m_currentIndex - 1], 'f', 2));
}
//
// Update the chart and the viewport periodically
//
void RealTimeMultiChart::onChartUpdateTimer()
{
if (m_currentIndex > 0)
{
//
// As we added more data, we may need to update the full range of the viewport.
//
double startDate = m_timeStamps[0];
double endDate = m_timeStamps[m_currentIndex - 1];
// Use the initialFullRange (which is 60 seconds in this demo) if this is sufficient.
double duration = endDate - startDate;
if (duration < initialFullRange)
endDate = startDate + initialFullRange;
// Update the full range to reflect the actual duration of the data. In this case,
// if the view port is viewing the latest data, we will scroll the view port as new
// data are added. If the view port is viewing historical data, we would keep the
// axis scale unchanged to keep the chart stable.
int updateType = Chart::ScrollWithMax;
if (m_ChartViewer->getViewPortLeft() + m_ChartViewer->getViewPortWidth() < 0.999)
updateType = Chart::KeepVisibleRange;
bool scaleHasChanged = m_ChartViewer->updateFullRangeH("x", startDate, endDate, updateType);
// Set the zoom in limit as a ratio to the full range
m_ChartViewer->setZoomInWidthLimit(zoomInLimit / (m_ChartViewer->getValueAtViewPort("x", 1) -
m_ChartViewer->getValueAtViewPort("x", 0)));
// Trigger the viewPortChanged event to update the display if the axis scale has changed
// or if new data are added to the existing axis scale.
if (scaleHasChanged || (duration < initialFullRange))
m_ChartViewer->updateViewPort(true, false);
}
}
//
// View port changed event
//
void RealTimeMultiChart::onViewPortChanged()
{
// In addition to updating the chart, we may also need to update other controls that
// changes based on the view port.
updateControls(m_ChartViewer);
// Update the chart if necessary
if (m_ChartViewer->needUpdateChart())
drawMultiChart(m_ChartViewer);
}
//
// User clicks on the the horizontal scroll bar
//
void RealTimeMultiChart::onHScrollBarChanged(int value)
{
if (!m_ChartViewer->isInViewPortChangedEvent())
{
// Set the view port based on the scroll bar
int scrollBarLen = m_HScrollBar->maximum() + m_HScrollBar->pageStep();
m_ChartViewer->setViewPortLeft(value / (double)scrollBarLen);
// Update the chart display without updating the image maps. (We can delay updating
// the image map until scrolling is completed and the chart display is stable.)
m_ChartViewer->updateViewPort(true, false);
}
}
//
// Update controls in the user interface when the view port changed
//
void RealTimeMultiChart::updateControls(QChartViewer *viewer)
{
// The logical length of the scrollbar. It can be any large value. The actual value does
// not matter.
const int scrollBarLen = 1000000000;
// Update the horizontal scroll bar
m_HScrollBar->setEnabled(viewer->getViewPortWidth() < 1);
m_HScrollBar->setPageStep((int)ceil(viewer->getViewPortWidth() * scrollBarLen));
m_HScrollBar->setSingleStep((std::min)(scrollBarLen / 100, m_HScrollBar->pageStep()));
m_HScrollBar->setRange(0, scrollBarLen - m_HScrollBar->pageStep());
m_HScrollBar->setValue((int)(0.5 + viewer->getViewPortLeft() * scrollBarLen));
}
//
// Draw track cursor when mouse is moving over plotarea
//
void RealTimeMultiChart::onMouseMovePlotArea(QMouseEvent *)
{
drawMultiTrackLine((MultiChart*)m_ChartViewer->getChart(), m_ChartViewer->getPlotAreaMouseX());
m_ChartViewer->updateDisplay();
}
//
// Draw a single chart
//
XYChart* RealTimeMultiChart::drawXYChart(QChartViewer *viewer, const double* dataSeries,
const char *name, int color, Axis* xAxisScale, bool xAxisVisible)
{
// Get the start date and end date that are visible on the chart.
double viewPortStartDate = viewer->getValueAtViewPort("x", viewer->getViewPortLeft());
double viewPortEndDate = viewer->getValueAtViewPort("x", viewer->getViewPortRight());
// Extract the part of the data arrays that are visible.
DoubleArray viewPortTimeStamps;
DoubleArray viewPortDataSeries;
if (m_currentIndex > 0)
{
// Get the array indexes that corresponds to the visible start and end dates
int startIndex = (int)floor(Chart::bSearch(DoubleArray(m_timeStamps, m_currentIndex), viewPortStartDate));
int endIndex = (int)ceil(Chart::bSearch(DoubleArray(m_timeStamps, m_currentIndex), viewPortEndDate));
int noOfPoints = endIndex - startIndex + 1;
// Extract the visible data
viewPortTimeStamps = DoubleArray(m_timeStamps + startIndex, noOfPoints);
viewPortDataSeries = DoubleArray(dataSeries + startIndex, noOfPoints);
}
//
// At this stage, we have extracted the visible data. We can use those data to plot the chart.
//
//================================================================================
// Configure overall chart appearance.
//================================================================================
// Only the last chart has an x-axis
int extraHeght = xAxisVisible ? xAxisHeight : 0;
// Create an XYChart object of size 640 x 150 pixels (or 180 pixels for the last chart)
XYChart* c = new XYChart(640, chartHeight + extraHeght);
// Set the plotarea at (55, 10) with width 80 pixels less than chart width, and height 20 pixels
// less than chart height. Use a vertical gradient from light blue (f0f6ff) to sky blue (a0c0ff)
// as background. Set border to transparent and grid lines to white (ffffff).
c->setPlotArea(55, 10, c->getWidth() - 85, c->getHeight() - 20 - extraHeght, c->linearGradientColor(0, 10, 0,
c->getHeight() - 20 - extraHeght, 0xf0f6ff, 0xa0c0ff), -1, Chart::Transparent, 0xffffff, 0xffffff);
// As the data can lie outside the plotarea in a zoomed chart, we need enable clipping.
c->setClipping();
// Add a legend box at (55, 5) using horizontal layout. Use 8pts Arial Bold as font. Set the
// background and border color to Transparent and use line style legend key.
LegendBox* b = c->addLegend(55, 5, false, "Arial Bold", 10);
b->setBackground(Chart::Transparent);
b->setLineStyleKey();
// Set the x and y axis stems to transparent and the label font to 10pt Arial
c->xAxis()->setColors(Chart::Transparent);
c->yAxis()->setColors(Chart::Transparent);
c->xAxis()->setLabelStyle("Arial", 10);
c->yAxis()->setLabelStyle("Arial", 10);
// Add axis title using 10pts Arial Bold Italic font
c->yAxis()->setTitle(name, "Arial Bold", 10);
//================================================================================
// Add data to chart
//================================================================================
// Add a line layer with the given data, with a line width of 2 pixels.
LineLayer* layer = c->addLineLayer();
layer->setLineWidth(2);
layer->setXData(viewPortTimeStamps);
layer->addDataSet(viewPortDataSeries, color, name);
//================================================================================
// Configure axis scale and labelling
//================================================================================
// For the automatic axis labels, set the minimum spacing to 30 pixels for the y axis.
c->yAxis()->setTickDensity(30);
if (0 != xAxisScale)
{
// If xAxisScale is given, then use it to synchronize with other charts.
c->xAxis()->copyAxis(xAxisScale);
}
else if (m_currentIndex > 0)
{
// If xAxisScale is null, this is the first chart, and it needs to set up the axis scale.
c->xAxis()->setDateScale(viewPortStartDate, viewPortEndDate);
// For the automatic axis labels, set the minimum spacing to 75 pixels for the x axis.
c->xAxis()->setTickDensity(75);
//
// In this example, the axis range can change from a few seconds to thousands of seconds.
// We can need to define the axis label format for the various cases.
//
// If all ticks are minute algined, then we use "hh:nn" as the label format.
c->xAxis()->setFormatCondition("align", 60);
c->xAxis()->setLabelFormat("{value|hh:nn}");
// If all other cases, we use "hh:nn:ss" as the label format.
c->xAxis()->setFormatCondition("else");
c->xAxis()->setLabelFormat("{value|hh:nn:ss}");
// We make sure the tick increment must be at least 1 second.
c->xAxis()->setMinTickInc(1);
}
// Hide the x-axis if it is not visible.
if (!xAxisVisible)
c->xAxis()->setColors(Chart::Transparent, Chart::Transparent);
//================================================================================
// Output the chart
//================================================================================
return c;
}
//
// Draw the MultiChart
//
void RealTimeMultiChart::drawMultiChart(QChartViewer* viewer)
{
// The MultiChart contains 3 charts. The x-axis is only visible on the last chart, so we only
// need to reserve space for 1 x-axis.
MultiChart* m = new MultiChart(640, 30 + 3 * chartHeight + xAxisHeight);
m->addTitle("Real-Time MultiChart with Zoom/Scroll and Track Line", "Arial", 16);
// This first chart is responsible for setting up the x-axis scale.
m->addChart(0, 30, drawXYChart(viewer, m_dataSeriesA, "Alpha", 0xff0000, 0, false));
Axis* xAxisScale = ((XYChart*)m->getChart(0))->xAxis();
// All other charts synchronize their x-axes with that of the first chart.
m->addChart(0, 30 + chartHeight, drawXYChart(viewer, m_dataSeriesB, "Beta", 0x00cc00,
xAxisScale, false));
// The last chart displays the x-axis.
m->addChart(0, 30 + chartHeight * 2, drawXYChart(viewer, m_dataSeriesC, "Gamma", 0x0000ff,
xAxisScale, true));
// We need to update the track line too. If the mouse is moving on the chart, the track line
// will be updated in MouseMovePlotArea. Otherwise, we need to update the track line here.
if (!viewer->isInMouseMoveEvent())
drawMultiTrackLine(m, (0 == viewer->getChart()) ? m->getWidth() : viewer->getPlotAreaMouseX());
// Set the combined plot area to be the bounding box of the plot areas of the 3 charts
m->setMainChart(m);
deleteMultiChart((MultiChart*)viewer->getChart());
viewer->setChart(m);
}
void RealTimeMultiChart::deleteMultiChart(MultiChart *m)
{
if (0 != m)
{
// Delete all the charts inside the MultiChart, then delete the MultiChart itself.
for (int i = 0; i < m->getChartCount(); ++i)
delete m->getChart(i);
delete m;
}
}
void RealTimeMultiChart::drawMultiTrackLine(MultiChart* m, int mouseX)
{
// Obtain the dynamic layer of the MultiChart
DrawArea* d = m->initDynamicLayer();
// Ask each XYChart to draw the track cursor on the dynamic layer
for (int i = 0; i < m->getChartCount(); ++i)
drawXYTrackLine(d, (XYChart*)m->getChart(i), mouseX, i == m->getChartCount() - 1);
}
//
// Draw track line with data labels
//
void RealTimeMultiChart::drawXYTrackLine(DrawArea* d, XYChart* c, int mouseX, bool hasXAxis)
{
// In a MultiChart, the XYChart is offsetted from the dynamic layer of the MultiChart
int offsetY = c->getAbsOffsetY();
// The plot area object
PlotArea* plotArea = c->getPlotArea();
// Get the data x-value that is nearest to the mouse, and find its pixel coordinate.
double xValue = c->getNearestXValue(mouseX);
int xCoor = c->getXCoor(xValue);
if (xCoor < plotArea->getLeftX())
return;
// Draw a vertical track line at the x-position
d->vline(plotArea->getTopY() + offsetY, plotArea->getBottomY() + offsetY, xCoor, 0x888888);
// Draw a label on the x-axis to show the track line position.
if (hasXAxis)
{
std::ostringstream xlabel;
xlabel << "<*font,bgColor=000000*> " << c->xAxis()->getFormattedLabel(xValue, "hh:nn:ss.ff")
<< " <*/font*>";
TTFText* t = d->text(xlabel.str().c_str(), "Arial Bold", 10);
// Restrict the x-pixel position of the label to make sure it stays inside the chart image.
int xLabelPos = (std::max)(0, (std::min)(xCoor - t->getWidth() / 2, c->getWidth() - t->getWidth()));
t->draw(xLabelPos, plotArea->getBottomY() + 6 + offsetY, 0xffffff);
t->destroy();
}
// Iterate through all layers to draw the data labels
for (int i = 0; i < c->getLayerCount(); ++i)
{
Layer* layer = c->getLayerByZ(i);
// The data array index of the x-value
int xIndex = layer->getXIndexOf(xValue);
// Iterate through all the data sets in the layer
for (int j = 0; j < layer->getDataSetCount(); ++j)
{
DataSet* dataSet = layer->getDataSetByZ(j);
const char* dataSetName = dataSet->getDataName();
// Get the color and position of the data label
int color = dataSet->getDataColor();
int yCoor = c->getYCoor(dataSet->getPosition(xIndex), dataSet->getUseYAxis());
// Draw a track dot with a label next to it for visible data points in the plot area
if ((yCoor >= plotArea->getTopY()) && (yCoor <= plotArea->getBottomY()) && (color !=
Chart::Transparent) && dataSetName && *dataSetName)
{
d->circle(xCoor, yCoor + offsetY, 4, 4, color, color);
std::ostringstream label;
label << "<*font,bgColor=" << std::hex << color << "*> "
<< c->formatValue(dataSet->getValue(xIndex), "{value|P4}") << " <*font*>";
TTFText*t = d->text(label.str().c_str(), "Arial Bold", 10);
// Draw the label on the right side of the dot if the mouse is on the left side the
// chart, and vice versa. This ensures the label will not go outside the chart image.
if (xCoor <= (plotArea->getLeftX() + plotArea->getRightX()) / 2)
t->draw(xCoor + 6, yCoor + offsetY, 0xffffff, Chart::Left);
else
t->draw(xCoor - 6, yCoor + offsetY, 0xffffff, Chart::Right);
t->destroy();
}
}
}
}
[QML/Qt Quick version] qmldemo/realtimemultichart.qml
import QtQuick
import QtQuick.Window
import QtQuick.Controls
import QtQuick.Dialogs
import advsofteng.com 1.0

Window {
    title: "Real-Time MultiChart with Zoom/Scroll and Track Line"
    visible: true
    modality: Qt.ApplicationModal
    width: 770
    minimumWidth: 770
    maximumWidth: 770
    height: 445
    minimumHeight: 445
    maximumHeight: 445

    Pane {
        id: leftPane
        width: 120
        padding: 5
        anchors.top: parent.top;
        anchors.bottom: parent.bottom;

        Column {
            Button {
                width: 110
                contentItem: Row {
                    padding: 2; leftPadding: 5
                    Image { source: "icons/scroll_icon.png"; width:16; height:16; }
                    Text { text: "  Pointer"; font.pixelSize: 13; }
                }
                checked: viewer.mouseUsage == QmlChartViewer.MouseUsageScroll
                onClicked: viewer.mouseUsage = QmlChartViewer.MouseUsageScroll
            }
            Button
            {
                width: 110
                contentItem: Row {
                    padding: 2; leftPadding: 5;
                    Image { source: "icons/zoomin_icon.png"; width:16; height:16; }
                    Text { text: "  Zoom In"; font.pixelSize: 13; }
                }
                checked: viewer.mouseUsage == QmlChartViewer.MouseUsageZoomIn
                onClicked: viewer.mouseUsage = QmlChartViewer.MouseUsageZoomIn
            }
            Button {
                width: 110
                contentItem: Row {
                    padding: 2; leftPadding: 5
                    Image { source: "icons/zoomout_icon.png"; width:16; height:16; }
                    Text { text: "  Zoom Out"; font.pixelSize: 13; }
                }
                checked: viewer.mouseUsage == QmlChartViewer.MouseUsageZoomOut
                onClicked: viewer.mouseUsage = QmlChartViewer.MouseUsageZoomOut
            }

            // Spacer
            Item {width: 1; height: 30}

            Button {
                width: 110
                contentItem: Row {
                    padding: 2; leftPadding: 5
                    Image { source: "icons/save_icon.png"; width:16; height:16; }
                    Text { text: "  Save"; font.pixelSize: 12; }
                }
                onClicked: saveImageDialog.open()

                FileDialog {
                    id: saveImageDialog
                    title: "Save"
                    currentFile: "chartdirector_demo"
                    fileMode: FileDialog.SaveFile
                    nameFilters: ["PNG (*.png);", "JPG (*.jpg)", "GIF (*.gif)", "BMP (*.bmp)", "SVG (*.svg)", "PDF (*.pdf)"]
                    onAccepted: demo.saveChartImage(viewer, selectedFile)
                }
            }

            // Spacer
            Item {width: 1; height: 30}

            Text {
                text: "Update Period (ms)"
                bottomPadding: 3
            }

            ComboBox {
                width: 110
                model: ["100ms", "200ms", "300ms", "500ms", "700ms", "1000ms"]
                onActivated: chartUpdateTimer.interval = parseInt(currentText)
            }
        }

        Column {
            anchors.bottom: parent.bottom;
            anchors.bottomMargin: 20
            spacing: 4

            Row {
                Text { text: "Alpha:"; width: 55 }
                Rectangle {
                    width: 55
                    height: childrenRect.height + 4
                    border.color: "#888888"
                    Text { x: 3; id: alphaValue; }
                }
            }
            Row {
                Text { text: "Beta:"; width: 55 }
                Rectangle {
                    width: 55
                    height: childrenRect.height + 4
                    border.color: "#888888"
                    Text { x: 3; id: betaValue; }
                }
            }
            Row {
                Text { text: "Gamma:"; width: 55 }
                Rectangle {
                    width: 55
                    height: childrenRect.height + 4
                    border.color: "#888888"
                    Text { x: 3; id: gammaValue; }
                }
            }
        }
    }

    QmlChartViewer
    {
        id: viewer
        anchors.left: leftPane.right
        anchors.leftMargin: 5
        y: 5
        // set default mouse usage to scroll and mouse wheel to zoom
        mouseUsage: QmlChartViewer.MouseUsageScroll
        mouseWheelZoomRatio: 1.1
        // Update track cursor on mouse move
        onMouseMovePlotArea: demo.drawTrackCursor(this, plotAreaMouseX)
        // Update chart on viewport change. Update the scrollbar too.
        onViewPortChanged: {
            if (needUpdateChart)
                demo.drawChart(this);

            hScrollBar.size = Math.min(viewer.viewPortWidth, 0.999999999);
            hScrollBar.position = viewer.viewPortLeft;
        }

    }

    // Add scrollbar under the chart viewer
    ScrollBar
    {
        id: hScrollBar
        orientation: Qt.Horizontal
        height: 20
        anchors.bottom: parent.bottom
        anchors.left: viewer.left
        anchors.right: viewer.right

        onPositionChanged: {
            // The scrollbar and viewport can update each others. To avoid
            // infinite loop, the scrollbar will update the viewport only
            // if the viewport is not updating the scrollbar.
            if (!viewer.isInViewPortChangedEvent) {
                // update the viewport
                viewer.viewPortLeft = this.position;
                viewer.updateViewPort(true, false);
            }
        }
    }

    // The backend implementation of this demo.
    RealTimeMultiChart {
        id: demo;
    }

    // This example uses a random number generator that generates a random
    // number every 100ms. In real applications, the data can be generated
    // by other means.
    Timer {
        interval:100; running: true; repeat: true
        onTriggered: {
            demo.getData();
            alphaValue.text = demo.ValueA.toFixed(2);
            betaValue.text = demo.ValueB.toFixed(2);
            gammaValue.text = demo.ValueC.toFixed(2);
        }
    }

    // The chart update timer. The chart can update at a different rate from
    // the data, that is, asychronous update.
    Timer {
        id: chartUpdateTimer
        interval:100; running: true ; repeat: true
        onTriggered: demo.updateChart(viewer);
    }
}
[QML/Qt Quick version] qmldemo/realtimemultichart.cpp
#include "realtimemultichart.h"
#include <sstream>
#include <math.h>


//
// In this example, a 250ms timer is used to obtain real-time data.
//
static const int DataInterval = 100;

//
// The height of each XYChart. The bottom chart has an extra height for the x-axis labels.
//
static const int chartHeight = 120;
static const int xAxisHeight = 25;


RealTimeMultiChart::RealTimeMultiChart(QObject *parent) : QObject(parent)
{
    m_currentChart = 0;

    // Clear data arrays to Chart::NoValue
    for (int i = 0; i < sampleSize; ++i)
        m_timeStamps[i] = m_dataSeriesA[i] = m_dataSeriesB[i] = m_dataSeriesC[i] = Chart::NoValue;
    m_currentIndex = 0;

    // Set m_nextDataTime to the current time. It is used by the real time random number
    // generator so it knows what timestamp should be used for the next data point.
    m_nextDataTime = QDateTime::currentDateTime();
}

RealTimeMultiChart::~RealTimeMultiChart()
{
    deleteMultiChart((MultiChart*)m_currentChart);
}

//
// The data acquisition routine. In this demo, this is invoked every 250ms.
//
void RealTimeMultiChart::getData()
{
    // The current time
    QDateTime now = QDateTime::currentDateTime();

    // This is our formula for the random number generator
    do
    {
        // We need the currentTime in millisecond resolution
        qint64 t = m_nextDataTime.toMSecsSinceEpoch();
        double currentTime = Chart::chartTime2((int)(t / 1000)) + (t % 1000) / DataInterval
            * DataInterval / 1000.0;

        // Get a data sample
        double p = currentTime * 4;
        double dataA = 20 + cos(p * 129241) * 10 + 1 / (cos(p) * cos(p) + 0.01);
        double dataB = 150 + 100 * sin(p / 27.7) * sin(p / 10.1);
        double dataC = 150 + 100 * cos(p / 6.7) * cos(p / 11.9);

        // In this demo, if the data arrays are full, the oldest 5% of data are discarded.
        if (m_currentIndex >= sampleSize)
        {
            m_currentIndex = sampleSize * 95 / 100 - 1;

            for(int i = 0; i < m_currentIndex; ++i)
            {
                int srcIndex = i + sampleSize - m_currentIndex;
                m_timeStamps[i] = m_timeStamps[srcIndex];
                m_dataSeriesA[i] = m_dataSeriesA[srcIndex];
                m_dataSeriesB[i] = m_dataSeriesB[srcIndex];
                m_dataSeriesC[i] = m_dataSeriesC[srcIndex];
            }
        }

        // Store the new values in the current index position, and increment the index.
        m_timeStamps[m_currentIndex] = currentTime;
        m_dataSeriesA[m_currentIndex] = dataA;
        m_dataSeriesB[m_currentIndex] = dataB;
        m_dataSeriesC[m_currentIndex] = dataC;
        ++m_currentIndex;

        m_nextDataTime = m_nextDataTime.addMSecs(DataInterval);
    }
    while (m_nextDataTime < now);

    //
    // We provide some visual feedback to the latest numbers generated, so you can see the
    // data being generated.
    //
    m_ValueA = m_dataSeriesA[m_currentIndex - 1];
    m_ValueB = m_dataSeriesB[m_currentIndex - 1];
    m_ValueC = m_dataSeriesC[m_currentIndex - 1];
}

//
// Update the chart and the viewport periodically
//
void RealTimeMultiChart::updateChart(QmlChartViewer *viewer)
{
    if (m_currentIndex > 0)
    {
        //
        // As we added more data, we may need to update the full range of the viewport.
        //

        double startDate = m_timeStamps[0];
        double endDate = m_timeStamps[m_currentIndex - 1];

        // Use the initialFullRange (which is 60 seconds in this demo) if this is sufficient.
        double duration = endDate - startDate;
        if (duration < initialFullRange)
            endDate = startDate + initialFullRange;

        // Update the full range to reflect the actual duration of the data. In this case,
        // if the view port is viewing the latest data, we will scroll the view port as new
        // data are added. If the view port is viewing historical data, we would keep the
        // axis scale unchanged to keep the chart stable.
        int updateType = Chart::ScrollWithMax;
        if (viewer->getViewPortLeft() + viewer->getViewPortWidth() < 0.999)
            updateType = Chart::KeepVisibleRange;
        bool scaleHasChanged = viewer->updateFullRangeH("x", startDate, endDate, updateType);

        // Set the zoom in limit as a ratio to the full range
        viewer->setZoomInWidthLimit(zoomInLimit / (viewer->getValueAtViewPort("x", 1) -
            viewer->getValueAtViewPort("x", 0)));

        // Trigger the viewPortChanged event to update the display if the axis scale has changed
        // or if new data are added to the existing axis scale.
        if (scaleHasChanged || (duration < initialFullRange))
            viewer->updateViewPort(true, false);
    }
}

//
// Draw a single chart
//
XYChart* RealTimeMultiChart::drawXYChart(QmlChartViewer *viewer, const double* dataSeries,
    const char *name, int color, Axis* xAxisScale, bool xAxisVisible)
{
    // Get the start date and end date that are visible on the chart.
    double viewPortStartDate = viewer->getValueAtViewPort("x", viewer->getViewPortLeft());
    double viewPortEndDate = viewer->getValueAtViewPort("x", viewer->getViewPortRight());

    // Extract the part of the data arrays that are visible.
    DoubleArray viewPortTimeStamps;
    DoubleArray viewPortDataSeries;
    if (m_currentIndex > 0)
    {
        // Get the array indexes that corresponds to the visible start and end dates
        int startIndex = (int)floor(Chart::bSearch(DoubleArray(m_timeStamps, m_currentIndex), viewPortStartDate));
        int endIndex = (int)ceil(Chart::bSearch(DoubleArray(m_timeStamps, m_currentIndex), viewPortEndDate));
        int noOfPoints = endIndex - startIndex + 1;

        // Extract the visible data
        viewPortTimeStamps = DoubleArray(m_timeStamps + startIndex, noOfPoints);
        viewPortDataSeries = DoubleArray(dataSeries + startIndex, noOfPoints);
    }

    //
    // At this stage, we have extracted the visible data. We can use those data to plot the chart.
    //

    //================================================================================
    // Configure overall chart appearance.
    //================================================================================

    // Only the last chart has an x-axis
    int extraHeght = xAxisVisible ? xAxisHeight : 0;

    // Create an XYChart object of size 640 x 150 pixels (or 180 pixels for the last chart)
    XYChart* c = new XYChart(640, chartHeight + extraHeght);

    // Set the plotarea at (55, 10) with width 80 pixels less than chart width, and height 20 pixels
    // less than chart height. Use a vertical gradient from light blue (f0f6ff) to sky blue (a0c0ff)
    // as background. Set border to transparent and grid lines to white (ffffff).
    c->setPlotArea(55, 10, c->getWidth() - 85, c->getHeight() - 20 - extraHeght, c->linearGradientColor(0, 10, 0,
        c->getHeight() - 20 - extraHeght, 0xf0f6ff, 0xa0c0ff), -1, Chart::Transparent, 0xffffff, 0xffffff);

    // As the data can lie outside the plotarea in a zoomed chart, we need enable clipping.
    c->setClipping();

    // Add a legend box at (55, 5) using horizontal layout. Use 8pts Arial Bold as font. Set the
    // background and border color to Transparent and use line style legend key.
    LegendBox* b = c->addLegend(55, 5, false, "Arial Bold", 10);
    b->setBackground(Chart::Transparent);
    b->setLineStyleKey();

    // Set the x and y axis stems to transparent and the label font to 10pt Arial
    c->xAxis()->setColors(Chart::Transparent);
    c->yAxis()->setColors(Chart::Transparent);
    c->xAxis()->setLabelStyle("Arial", 10);
    c->yAxis()->setLabelStyle("Arial", 10);

    // Add axis title using 10pts Arial Bold Italic font
    c->yAxis()->setTitle(name, "Arial Bold", 10);

    //================================================================================
    // Add data to chart
    //================================================================================

    // Add a line layer with the given data, with a line width of 2 pixels.
    LineLayer* layer = c->addLineLayer();
    layer->setLineWidth(2);
    layer->setXData(viewPortTimeStamps);
    layer->addDataSet(viewPortDataSeries, color, name);

    //================================================================================
    // Configure axis scale and labelling
    //================================================================================

    // For the automatic axis labels, set the minimum spacing to 30 pixels for the y axis.
    c->yAxis()->setTickDensity(30);

    if (0 != xAxisScale)
    {
        // If xAxisScale is given, then use it to synchronize with other charts.
        c->xAxis()->copyAxis(xAxisScale);
    }
    else if (m_currentIndex > 0)
    {
        // If xAxisScale is null, this is the first chart, and it needs to set up the axis scale.
        c->xAxis()->setDateScale(viewPortStartDate, viewPortEndDate);

        // For the automatic axis labels, set the minimum spacing to 75 pixels for the x axis.
        c->xAxis()->setTickDensity(75);

        //
        // In this example, the axis range can change from a few seconds to thousands of seconds.
        // We can need to define the axis label format for the various cases.
        //

        // If all ticks are minute algined, then we use "hh:nn" as the label format.
        c->xAxis()->setFormatCondition("align", 60);
        c->xAxis()->setLabelFormat("{value|hh:nn}");

        // If all other cases, we use "hh:nn:ss" as the label format.
        c->xAxis()->setFormatCondition("else");
        c->xAxis()->setLabelFormat("{value|hh:nn:ss}");

        // We make sure the tick increment must be at least 1 second.
        c->xAxis()->setMinTickInc(1);
    }

    // Hide the x-axis if it is not visible.
    if (!xAxisVisible)
        c->xAxis()->setColors(Chart::Transparent, Chart::Transparent);

    //================================================================================
    // Output the chart
    //================================================================================

    return c;
}

//
// Draw the chart
//
void RealTimeMultiChart::drawChart(QmlChartViewer* viewer)
{
    drawMultiChart(viewer);
}

//
// Draw the MultiChart
//
void RealTimeMultiChart::drawMultiChart(QmlChartViewer* viewer)
{
    // The MultiChart contains 3 charts. The x-axis is only visible on the last chart, so we only
    // need to reserve space for 1 x-axis.
    MultiChart* m = new MultiChart(640, 30 + 3 * chartHeight + xAxisHeight);
    m->addTitle("Real-Time MultiChart with Zoom/Scroll and Track Line", "Arial", 16);

    // This first chart is responsible for setting up the x-axis scale.
    m->addChart(0, 30, drawXYChart(viewer, m_dataSeriesA, "Alpha", 0xff0000, 0, false));
    Axis* xAxisScale = ((XYChart*)m->getChart(0))->xAxis();

    // All other charts synchronize their x-axes with that of the first chart.
    m->addChart(0, 30 + chartHeight, drawXYChart(viewer, m_dataSeriesB, "Beta", 0x00cc00,
        xAxisScale, false));

    // The last chart displays the x-axis.
    m->addChart(0, 30 + chartHeight * 2, drawXYChart(viewer, m_dataSeriesC, "Gamma", 0x0000ff,
        xAxisScale,  true));

    // We need to update the track line too. If the mouse is moving on the chart, the track line
    // will be updated in MouseMovePlotArea. Otherwise, we need to update the track line here.
    if (!viewer->isInMouseMoveEvent())
        drawMultiTrackLine(m, (0 == viewer->getChart()) ? m->getWidth() : viewer->getPlotAreaMouseX());

    // Set the combined plot area to be the bounding box of the plot areas of the 3 charts
    m->setMainChart(m);

    deleteMultiChart((MultiChart*)viewer->getChart());
    viewer->setChart(m_currentChart = m);
}

void RealTimeMultiChart::deleteMultiChart(MultiChart *m)
{
    if (0 != m)
    {
        // Delete all the charts inside the MultiChart, then delete the MultiChart itself.
        for (int i = 0; i < m->getChartCount(); ++i)
            delete m->getChart(i);
        delete m;
    }
}

void RealTimeMultiChart::drawTrackCursor(QmlChartViewer *viewer, int mouseX)
{
    drawMultiTrackLine((MultiChart*)viewer->getChart(), mouseX);
}

void RealTimeMultiChart::drawMultiTrackLine(MultiChart* m, int mouseX)
{
    // Obtain the dynamic layer of the MultiChart
    DrawArea* d = m->initDynamicLayer();

    // Ask each XYChart to draw the track cursor on the dynamic layer
    for (int i = 0; i < m->getChartCount(); ++i)
        drawXYTrackLine(d, (XYChart*)m->getChart(i), mouseX, i == m->getChartCount() - 1);
}

//
// Draw track line with data labels
//
void RealTimeMultiChart::drawXYTrackLine(DrawArea* d, XYChart* c, int mouseX, bool hasXAxis)
{
    // In a MultiChart, the XYChart is offsetted from the dynamic layer of the MultiChart
    int offsetY = c->getAbsOffsetY();

    // The plot area object
    PlotArea* plotArea = c->getPlotArea();

    // Get the data x-value that is nearest to the mouse, and find its pixel coordinate.
    double xValue = c->getNearestXValue(mouseX);
    int xCoor = c->getXCoor(xValue);
    if (xCoor < plotArea->getLeftX())
        return;

    // Draw a vertical track line at the x-position
    d->vline(plotArea->getTopY() + offsetY, plotArea->getBottomY() + offsetY, xCoor, 0x888888);

    // Draw a label on the x-axis to show the track line position.
    if (hasXAxis)
    {
        std::ostringstream xlabel;
        xlabel << "<*font,bgColor=000000*> " << c->xAxis()->getFormattedLabel(xValue, "hh:nn:ss.ff")
            << " <*/font*>";
        TTFText* t = d->text(xlabel.str().c_str(), "Arial Bold", 10);

        // Restrict the x-pixel position of the label to make sure it stays inside the chart image.
        int xLabelPos = (std::max)(0, (std::min)(xCoor - t->getWidth() / 2, c->getWidth() - t->getWidth()));
        t->draw(xLabelPos, plotArea->getBottomY() + 6 + offsetY, 0xffffff);
        t->destroy();
    }

    // Iterate through all layers to draw the data labels
    for (int i = 0; i < c->getLayerCount(); ++i)
    {
        Layer* layer = c->getLayerByZ(i);

        // The data array index of the x-value
        int xIndex = layer->getXIndexOf(xValue);

        // Iterate through all the data sets in the layer
        for (int j = 0; j < layer->getDataSetCount(); ++j)
        {
            DataSet* dataSet = layer->getDataSetByZ(j);
            const char* dataSetName = dataSet->getDataName();

            // Get the color and position of the data label
            int color = dataSet->getDataColor();
            int yCoor = c->getYCoor(dataSet->getPosition(xIndex), dataSet->getUseYAxis());

            // Draw a track dot with a label next to it for visible data points in the plot area
            if ((yCoor >= plotArea->getTopY()) && (yCoor <= plotArea->getBottomY()) && (color !=
                Chart::Transparent) && dataSetName && *dataSetName)
            {
                d->circle(xCoor, yCoor + offsetY, 4, 4, color, color);

                std::ostringstream label;
                label << "<*font,bgColor=" << std::hex << color << "*> "
                    << c->formatValue(dataSet->getValue(xIndex), "{value|P4}") << " <*font*>";
                TTFText*t = d->text(label.str().c_str(), "Arial Bold", 10);

                // Draw the label on the right side of the dot if the mouse is on the left side the
                // chart, and vice versa. This ensures the label will not go outside the chart image.
                if (xCoor <= (plotArea->getLeftX() + plotArea->getRightX()) / 2)
                    t->draw(xCoor + 6, yCoor + offsetY, 0xffffff, Chart::Left);
                else
                    t->draw(xCoor - 6, yCoor + offsetY, 0xffffff, Chart::Right);

                t->destroy();
            }
        }
    }
}

//
// User clicks on the Save Chart pushbutton
//
void RealTimeMultiChart::saveChartImage(QmlChartViewer *viewer, QUrl url)
{
    QString path = url.toLocalFile();
    if (!path.isEmpty())
    {
        // Save the chart
        BaseChart *c = viewer->getChart();
        if (0 != c)
            c->makeChart(path.toUtf8().constData());
    }
}
© 2023 Advanced Software Engineering Limited. All rights reserved.