
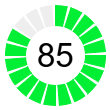
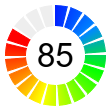
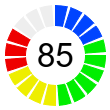
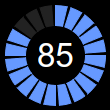
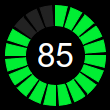
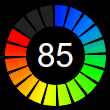
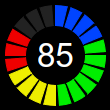
This example demonstrates circular bar meters in segmented style.
This example is similar to the Circular Bar Meter example except that the ring sectors are segmented.
ChartDirector 7.0 (Java Edition)
Circular Bar Meter (2)
Source Code Listing
<%@page import="ChartDirector.*, java.util.*" %>
<%!
// Function to create the demo charts
void createChart(WebChartViewer viewer, int chartIndex)
{
    // The value to display on the meter
    double value = 85;

    // The meter radius and angle
    int radius = 50;
    double angle = value * 360.0 / 100;

    // Create an AngularMeter with transparent background
    AngularMeter m = new AngularMeter(radius * 2 + 10, radius * 2 + 10, Chart.Transparent);

    // Set the center, radius and angular range of the meter
    m.setMeter(m.getWidth() / 2, m.getHeight() / 2, radius, 0, 360);

    // For circular bar meters, we do not need pointer or graduation, so we hide them.
    m.setMeterColors(Chart.Transparent, Chart.Transparent, Chart.Transparent);
    m.setCap(0, Chart.Transparent);

    // In this example, the circular bar has 20 segments
    int segmentCount = 20;

    // The angular step
    double angleStep = 360.0 / segmentCount;

    // The gap between segments is 4.5 degrees
    double angleGap = 4.5;

    //
    // This example demonstrates several coloring styles
    //

    // Thd default fill and blank colors
    int fillColor = 0x336699;
    int blankColor = 0xeeeeee;

    if (chartIndex >= 4) {
        // Use dark background style
        m.setColors(Chart.whiteOnBlackPalette);
        fillColor = 0x6699ff;
        blankColor = 0x222222;
    }

    if (chartIndex % 4 == 1) {
        // Alternative fill color
        fillColor = 0x00ee33;
    } else if (chartIndex % 4 == 2) {
        // Use a smooth color scale as the fill color
        int[] smoothColorScale = {0, 0x0022ff, 15, 0x0088ff, 30, 0x00ff00, 55, 0xffff00, 80,
            0xff0000, 100, 0xff0000};
        fillColor = m.getDrawArea().angleGradientColor(m.getWidth() / 2, m.getHeight() / 2, 0, 360,
            radius, radius - 20, smoothColorScale);
    } else if (chartIndex % 4 == 3) {
        // Use a step color scale as the fill color
        int[] stepColorScale = {0, 0x0044ff, 20, 0x00ee00, 50, 0xeeee00, 70, 0xee0000, 100};
        fillColor = m.getDrawArea().angleGradientColor(m.getWidth() / 2, m.getHeight() / 2,
            -angleGap / 2, 360 - angleGap / 2, radius, radius - 20, stepColorScale);
    }

    //
    // Now we draw the segments of the bar meter
    //

    // The segment that contains the value
    int currentSegment = (int)(angle / angleStep);

    // Segments after the current segment is colored with the blank color
    for(int i = currentSegment + 1; i < segmentCount; ++i) {
        m.addRingSector(radius, radius - 20, i * angleStep, (i + 1) * angleStep - angleGap,
            blankColor);
    }

    // Segments before the current segment is colored with the fill color
    for(int i = 0; i < currentSegment; ++i) {
        m.addRingSector(radius, radius - 20, i * angleStep, (i + 1) * angleStep - angleGap,
            fillColor);
    }

    // Segment that contains the angle will be partially filled and partially blank. We need to
    // adjust the angle to compensated for the angle gap.
    double adjustedAngle = currentSegment * angleStep + (angle - currentSegment * angleStep) * (1 -
        angleGap / angleStep);

    // The blank part of the segment
    if ((currentSegment + 1) * angleStep > angle) {
        m.addRingSector(radius, radius - 20, adjustedAngle, (currentSegment + 1) * angleStep -
            angleGap, blankColor);
    }

    // The filled part of the segment.
    if (angle > currentSegment * angleStep) {
        m.addRingSector(radius, radius - 20, currentSegment * angleStep, adjustedAngle, fillColor);
    }

    // Add a label at the center to display the value
    m.addText(m.getWidth() / 2, m.getHeight() / 2, m.formatValue(value, "{value}"), "Arial", 25,
        Chart.TextColor, Chart.Center).setMargin(0);

    // Output the chart
    viewer.setChart(m, Chart.SVG);
}
%>
<%
// This example includes 8 charts
WebChartViewer[] viewers = new WebChartViewer[8];
for (int i = 0; i < viewers.length; ++i) {
    viewers[i] = new WebChartViewer(request, "chart" + i);
    createChart(viewers[i], i);
}
%>
<!DOCTYPE html>
<html>
<head>
    <title>Circular Bar Meters (2)</title>
    <!-- Include ChartDirector Javascript Library to support chart interactions -->
    <script type="text/javascript" src="cdjcv.js"></script>
</head>
<body style="margin:5px 0px 0px 5px">
    <div style="font:bold 18pt verdana;">
        Circular Bar Meters (2)
    </div>
    <hr style="border:solid 1px #000080; background:#000080" />
    <div style="font:10pt verdana; margin-bottom:1.5em">
        <a href="viewsource.jsp?file=<%=request.getServletPath()%>">View Source Code</a>
    </div>
    <!-- ****** Here are the chart images ****** -->
    <%
        for (int i = 0; i < viewers.length; ++i) {
            out.write(viewers[i].renderHTML(response));
            out.write(" ");
        }
    %>
</body>
</html>