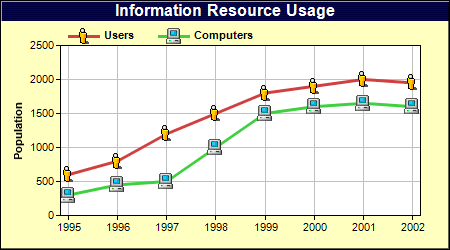
This example demonstrates loading external image files as data symbols by using DataSet.setDataSymbol2.
ChartDirector 7.1 (.NET Edition)
Custom Symbols
Source Code Listing
using System;
using ChartDirector;

namespace CSharpChartExplorer
{
    public class customsymbolline : DemoModule
    {
        //Name of demo module
        public string getName() { return "Custom Symbols"; }

        //Number of charts produced in this demo module
        public int getNoOfCharts() { return 1; }

        //Main code for creating chart.
        //Note: the argument chartIndex is unused because this demo only has 1 chart.
        public void createChart(WinChartViewer viewer, int chartIndex)
        {
            // The data for the chart
            double[] data0 = {600, 800, 1200, 1500, 1800, 1900, 2000, 1950};
            double[] data1 = {300, 450, 500, 1000, 1500, 1600, 1650, 1600};

            // The labels for the chart
            string[] labels = {"1995", "1996", "1997", "1998", "1999", "2000", "2001", "2002"};

            // Create a XYChart object of size 450 x 250 pixels, with a pale yellow (0xffffc0)
            // background, a black border, and 1 pixel 3D border effect.
            XYChart c = new XYChart(450, 250, 0xffffc0, 0, 1);

            // Set the plotarea at (60, 45) and of size 360 x 170 pixels, using white (0xffffff) as
            // the plot area background color. Turn on both horizontal and vertical grid lines with
            // light grey color (0xc0c0c0)
            c.setPlotArea(60, 45, 360, 170, 0xffffff, -1, -1, 0xc0c0c0, -1);

            // Add a legend box at (60, 20) (top of the chart) with horizontal layout. Use 8pt Arial
            // Bold font. Set the background and border color to Transparent.
            c.addLegend(60, 20, false, "Arial Bold", 8).setBackground(Chart.Transparent);

            // Add a title to the chart using 12pt Arial Bold/white font with a dark blue (000060)
            // background.
            c.addTitle("Information Resource Usage", "Arial Bold", 12, 0xffffff).setBackground(
                0x000060);

            // Set the labels on the x axis
            c.xAxis().setLabels(labels);

            // Reserve 8 pixels margins at both side of the x axis to avoid the first and last
            // symbols drawing outside of the plot area
            c.xAxis().setMargin(8, 8);

            // Add a title to the y axis
            c.yAxis().setTitle("Population");

            // Add a line layer to the chart
            LineLayer layer = c.addLineLayer2();

            // Add the first line using small_user.png as the symbol.
            layer.addDataSet(data0, 0xcf4040, "Users").setDataSymbol2("@/images/small_user.png");

            // Add the first line using small_computer.png as the symbol.
            layer.addDataSet(data1, 0x40cf40, "Computers").setDataSymbol2(
                "@/images/small_computer.png");

            // Set the line width to 3 pixels
            layer.setLineWidth(3);

            // Output the chart
            viewer.Chart = c;

            //include tool tip for the chart
            viewer.ImageMap = c.getHTMLImageMap("clickable", "",
                "title='Number of {dataSetName} at {xLabel}: {value}'");
        }
    }
}Imports System
Imports Microsoft.VisualBasic
Imports ChartDirector
Public Class customsymbolline
Implements DemoModule
'Name of demo module
Public Function getName() As String Implements DemoModule.getName
Return "Custom Symbols"
End Function
'Number of charts produced in this demo module
Public Function getNoOfCharts() As Integer Implements DemoModule.getNoOfCharts
Return 1
End Function
'Main code for creating chart.
'Note: the argument chartIndex is unused because this demo only has 1 chart.
Public Sub createChart(viewer As WinChartViewer, chartIndex As Integer) _
Implements DemoModule.createChart
' The data for the chart
Dim data0() As Double = {600, 800, 1200, 1500, 1800, 1900, 2000, 1950}
Dim data1() As Double = {300, 450, 500, 1000, 1500, 1600, 1650, 1600}
' The labels for the chart
Dim labels() As String = {"1995", "1996", "1997", "1998", "1999", "2000", "2001", "2002"}
' Create a XYChart object of size 450 x 250 pixels, with a pale yellow (0xffffc0)
' background, a black border, and 1 pixel 3D border effect.
Dim c As XYChart = New XYChart(450, 250, &Hffffc0, 0, 1)
' Set the plotarea at (60, 45) and of size 360 x 170 pixels, using white (0xffffff) as the
' plot area background color. Turn on both horizontal and vertical grid lines with light
' grey color (0xc0c0c0)
c.setPlotArea(60, 45, 360, 170, &Hffffff, -1, -1, &Hc0c0c0, -1)
' Add a legend box at (60, 20) (top of the chart) with horizontal layout. Use 8pt Arial Bold
' font. Set the background and border color to Transparent.
c.addLegend(60, 20, False, "Arial Bold", 8).setBackground(Chart.Transparent)
' Add a title to the chart using 12pt Arial Bold/white font with a dark blue (000060)
' background.
c.addTitle("Information Resource Usage", "Arial Bold", 12, &Hffffff).setBackground( _
&H000060)
' Set the labels on the x axis
c.xAxis().setLabels(labels)
' Reserve 8 pixels margins at both side of the x axis to avoid the first and last symbols
' drawing outside of the plot area
c.xAxis().setMargin(8, 8)
' Add a title to the y axis
c.yAxis().setTitle("Population")
' Add a line layer to the chart
Dim layer As LineLayer = c.addLineLayer2()
' Add the first line using small_user.png as the symbol.
layer.addDataSet(data0, &Hcf4040, "Users").setDataSymbol2("@/small_user.png")
' Add the first line using small_computer.png as the symbol.
layer.addDataSet(data1, &H40cf40, "Computers").setDataSymbol2("@/small_computer.png")
' Set the line width to 3 pixels
layer.setLineWidth(3)
' Output the chart
viewer.Chart = c
'include tool tip for the chart
viewer.ImageMap = c.getHTMLImageMap("clickable", "", _
"title='Number of {dataSetName} at {xLabel}: {value}'")
End Sub
End Classusing System;
using ChartDirector;
namespace CSharpWPFCharts
{
public class customsymbolline : DemoModule
{
//Name of demo module
public string getName() { return "Custom Symbols"; }
//Number of charts produced in this demo module
public int getNoOfCharts() { return 1; }
//Main code for creating chart.
//Note: the argument chartIndex is unused because this demo only has 1 chart.
public void createChart(WPFChartViewer viewer, int chartIndex)
{
// The data for the chart
double[] data0 = {600, 800, 1200, 1500, 1800, 1900, 2000, 1950};
double[] data1 = {300, 450, 500, 1000, 1500, 1600, 1650, 1600};
// The labels for the chart
string[] labels = {"1995", "1996", "1997", "1998", "1999", "2000", "2001", "2002"};
// Create a XYChart object of size 450 x 250 pixels, with a pale yellow (0xffffc0)
// background, a black border, and 1 pixel 3D border effect.
XYChart c = new XYChart(450, 250, 0xffffc0, 0, 1);
// Set the plotarea at (60, 45) and of size 360 x 170 pixels, using white (0xffffff) as
// the plot area background color. Turn on both horizontal and vertical grid lines with
// light grey color (0xc0c0c0)
c.setPlotArea(60, 45, 360, 170, 0xffffff, -1, -1, 0xc0c0c0, -1);
// Add a legend box at (60, 20) (top of the chart) with horizontal layout. Use 8pt Arial
// Bold font. Set the background and border color to Transparent.
c.addLegend(60, 20, false, "Arial Bold", 8).setBackground(Chart.Transparent);
// Add a title to the chart using 12pt Arial Bold/white font with a dark blue (000060)
// background.
c.addTitle("Information Resource Usage", "Arial Bold", 12, 0xffffff).setBackground(
0x000060);
// Set the labels on the x axis
c.xAxis().setLabels(labels);
// Reserve 8 pixels margins at both side of the x axis to avoid the first and last
// symbols drawing outside of the plot area
c.xAxis().setMargin(8, 8);
// Add a title to the y axis
c.yAxis().setTitle("Population");
// Add a line layer to the chart
LineLayer layer = c.addLineLayer2();
// Add the first line using small_user.png as the symbol.
layer.addDataSet(data0, 0xcf4040, "Users").setDataSymbol2("@/images/small_user.png");
// Add the first line using small_computer.png as the symbol.
layer.addDataSet(data1, 0x40cf40, "Computers").setDataSymbol2(
"@/images/small_computer.png");
// Set the line width to 3 pixels
layer.setLineWidth(3);
// Output the chart
viewer.Chart = c;
//include tool tip for the chart
viewer.ImageMap = c.getHTMLImageMap("clickable", "",
"title='Number of {dataSetName} at {xLabel}: {value}'");
}
}
}<%@ Page Language="C#" Debug="true" %>
<%@ Import Namespace="ChartDirector" %>
<%@ Register TagPrefix="chart" Namespace="ChartDirector" Assembly="netchartdir" %>
<!DOCTYPE html>
<script runat="server">
//
// Page Load event handler
//
protected void Page_Load(object sender, EventArgs e)
{
// The data for the chart
double[] data0 = {600, 800, 1200, 1500, 1800, 1900, 2000, 1950};
double[] data1 = {300, 450, 500, 1000, 1500, 1600, 1650, 1600};
// The labels for the chart
string[] labels = {"1995", "1996", "1997", "1998", "1999", "2000", "2001", "2002"};
// Create a XYChart object of size 450 x 250 pixels, with a pale yellow (0xffffc0) background, a
// black border, and 1 pixel 3D border effect.
XYChart c = new XYChart(450, 250, 0xffffc0, 0, 1);
// Set the plotarea at (60, 45) and of size 360 x 170 pixels, using white (0xffffff) as the plot
// area background color. Turn on both horizontal and vertical grid lines with light grey color
// (0xc0c0c0)
c.setPlotArea(60, 45, 360, 170, 0xffffff, -1, -1, 0xc0c0c0, -1);
// Add a legend box at (60, 20) (top of the chart) with horizontal layout. Use 8pt Arial Bold
// font. Set the background and border color to Transparent.
c.addLegend(60, 20, false, "Arial Bold", 8).setBackground(Chart.Transparent);
// Add a title to the chart using 12pt Arial Bold/white font with a dark blue (000060)
// background.
c.addTitle("Information Resource Usage", "Arial Bold", 12, 0xffffff).setBackground(0x000060);
// Set the labels on the x axis
c.xAxis().setLabels(labels);
// Reserve 8 pixels margins at both side of the x axis to avoid the first and last symbols
// drawing outside of the plot area
c.xAxis().setMargin(8, 8);
// Add a title to the y axis
c.yAxis().setTitle("Population");
// Add a line layer to the chart
LineLayer layer = c.addLineLayer2();
// Add the first line using small_user.png as the symbol.
layer.addDataSet(data0, 0xcf4040, "Users").setDataSymbol2(Server.MapPath("small_user.png"));
// Add the first line using small_computer.png as the symbol.
layer.addDataSet(data1, 0x40cf40, "Computers").setDataSymbol2(Server.MapPath(
"small_computer.png"));
// Set the line width to 3 pixels
layer.setLineWidth(3);
// Output the chart
WebChartViewer1.Image = c.makeWebImage(Chart.SVG);
// Include tool tip for the chart
WebChartViewer1.ImageMap = c.getHTMLImageMap("", "",
"title='Number of {dataSetName} at {xLabel}: {value}'");
}
</script>
<html>
<head>
<script type="text/javascript" src="cdjcv.js"></script>
</head>
<body>
<chart:WebChartViewer id="WebChartViewer1" runat="server" />
</body>
</html><%@ Page Language="VB" Debug="true" %>
<%@ Import Namespace="ChartDirector" %>
<%@ Register TagPrefix="chart" Namespace="ChartDirector" Assembly="netchartdir" %>
<!DOCTYPE html>
<script runat="server">
'
' Page Load event handler
'
Protected Sub Page_Load(ByVal sender As System.Object, ByVal e As System.EventArgs)
' The data for the chart
Dim data0() As Double = {600, 800, 1200, 1500, 1800, 1900, 2000, 1950}
Dim data1() As Double = {300, 450, 500, 1000, 1500, 1600, 1650, 1600}
' The labels for the chart
Dim labels() As String = {"1995", "1996", "1997", "1998", "1999", "2000", "2001", "2002"}
' Create a XYChart object of size 450 x 250 pixels, with a pale yellow (0xffffc0) background, a
' black border, and 1 pixel 3D border effect.
Dim c As XYChart = New XYChart(450, 250, &Hffffc0, 0, 1)
' Set the plotarea at (60, 45) and of size 360 x 170 pixels, using white (0xffffff) as the plot
' area background color. Turn on both horizontal and vertical grid lines with light grey color
' (0xc0c0c0)
c.setPlotArea(60, 45, 360, 170, &Hffffff, -1, -1, &Hc0c0c0, -1)
' Add a legend box at (60, 20) (top of the chart) with horizontal layout. Use 8pt Arial Bold
' font. Set the background and border color to Transparent.
c.addLegend(60, 20, False, "Arial Bold", 8).setBackground(Chart.Transparent)
' Add a title to the chart using 12pt Arial Bold/white font with a dark blue (000060)
' background.
c.addTitle("Information Resource Usage", "Arial Bold", 12, &Hffffff).setBackground(&H000060)
' Set the labels on the x axis
c.xAxis().setLabels(labels)
' Reserve 8 pixels margins at both side of the x axis to avoid the first and last symbols
' drawing outside of the plot area
c.xAxis().setMargin(8, 8)
' Add a title to the y axis
c.yAxis().setTitle("Population")
' Add a line layer to the chart
Dim layer As LineLayer = c.addLineLayer2()
' Add the first line using small_user.png as the symbol.
layer.addDataSet(data0, &Hcf4040, "Users").setDataSymbol2(Server.MapPath("small_user.png"))
' Add the first line using small_computer.png as the symbol.
layer.addDataSet(data1, &H40cf40, "Computers").setDataSymbol2(Server.MapPath( _
"small_computer.png"))
' Set the line width to 3 pixels
layer.setLineWidth(3)
' Output the chart
WebChartViewer1.Image = c.makeWebImage(Chart.SVG)
' Include tool tip for the chart
WebChartViewer1.ImageMap = c.getHTMLImageMap("", "", _
"title='Number of {dataSetName} at {xLabel}: {value}'")
End Sub
</script>
<html>
<head>
<script type="text/javascript" src="cdjcv.js"></script>
</head>
<body>
<chart:WebChartViewer id="WebChartViewer1" runat="server" />
</body>
</html>using System;
using System.Web.Mvc;
using ChartDirector;
namespace NetMvcCharts.Controllers
{
public class CustomsymbollineController : Controller
{
//
// Default Action
//
public ActionResult Index()
{
ViewBag.Title = "Custom Symbols";
createChart(ViewBag.Viewer = new RazorChartViewer(HttpContext, "chart1"));
return View("~/Views/Shared/ChartView.cshtml");
}
//
// Create chart
//
private void createChart(RazorChartViewer viewer)
{
// The data for the chart
double[] data0 = {600, 800, 1200, 1500, 1800, 1900, 2000, 1950};
double[] data1 = {300, 450, 500, 1000, 1500, 1600, 1650, 1600};
// The labels for the chart
string[] labels = {"1995", "1996", "1997", "1998", "1999", "2000", "2001", "2002"};
// Create a XYChart object of size 450 x 250 pixels, with a pale yellow (0xffffc0)
// background, a black border, and 1 pixel 3D border effect.
XYChart c = new XYChart(450, 250, 0xffffc0, 0, 1);
// Set the plotarea at (60, 45) and of size 360 x 170 pixels, using white (0xffffff) as the
// plot area background color. Turn on both horizontal and vertical grid lines with light
// grey color (0xc0c0c0)
c.setPlotArea(60, 45, 360, 170, 0xffffff, -1, -1, 0xc0c0c0, -1);
// Add a legend box at (60, 20) (top of the chart) with horizontal layout. Use 8pt Arial Bold
// font. Set the background and border color to Transparent.
c.addLegend(60, 20, false, "Arial Bold", 8).setBackground(Chart.Transparent);
// Add a title to the chart using 12pt Arial Bold/white font with a dark blue (000060)
// background.
c.addTitle("Information Resource Usage", "Arial Bold", 12, 0xffffff).setBackground(0x000060);
// Set the labels on the x axis
c.xAxis().setLabels(labels);
// Reserve 8 pixels margins at both side of the x axis to avoid the first and last symbols
// drawing outside of the plot area
c.xAxis().setMargin(8, 8);
// Add a title to the y axis
c.yAxis().setTitle("Population");
// Add a line layer to the chart
LineLayer layer = c.addLineLayer2();
// Add the first line using small_user.png as the symbol.
layer.addDataSet(data0, 0xcf4040, "Users").setDataSymbol2(Url.Content(
"~/Content/small_user.png"));
// Add the first line using small_computer.png as the symbol.
layer.addDataSet(data1, 0x40cf40, "Computers").setDataSymbol2(Url.Content(
"~/Content/small_computer.png"));
// Set the line width to 3 pixels
layer.setLineWidth(3);
// Output the chart
viewer.Image = c.makeWebImage(Chart.SVG);
// Include tool tip for the chart
viewer.ImageMap = c.getHTMLImageMap("", "",
"title='Number of {dataSetName} at {xLabel}: {value}'");
}
}
}@{ Layout = null; }
<!DOCTYPE html>
<html>
<head>
<meta name="viewport" content="width=device-width" />
<title>@ViewBag.Title</title>
<style>
@ViewBag.Style
</style>
@Scripts.Render("~/Scripts/cdjcv.js")
</head>
<body style="margin:5px 0px 0px 5px">
<div style="font:bold 18pt verdana;">
@ViewBag.Title
</div>
<hr style="border:solid 1px #000080; background:#000080" />
<div>
@{
if (ViewBag.Viewer is Array)
{
// Display multiple charts
for (int i = 0; i < ViewBag.Viewer.Length; ++i)
{
@:@Html.Raw(ViewBag.Viewer[i].RenderHTML())
}
}
else
{
// Display one chart only
@:@Html.Raw(ViewBag.Viewer.RenderHTML())
}
}
</div>
</body>
</html>