[Web Version (in ASP)] aspdemo\circularbarmeter.asp
<%@ language="vbscript" %>
<%
Set cd = CreateObject("ChartDirector.API")
' This script can draw different charts depending on the chartIndex
Sub createChart(viewer, chartIndex)
' The value to display on the meter
value = 77
' The meter radius and angle
radius = 50
angle = value * 360.0 / 100
' Create an AngularMeter with transparent background
Set m = cd.AngularMeter(radius * 2 + 10, radius * 2 + 10, cd.Transparent)
' Set the center, radius and angular range of the meter
Call m.setMeter(Int(m.getWidth() / 2), Int(m.getHeight() / 2), radius, 0, 360)
' For circular bar meters, we do not need pointer or graduation, so we hide them.
Call m.setMeterColors(cd.Transparent, cd.Transparent, cd.Transparent)
Call m.setCap(0, cd.Transparent)
'
' This example demonstrates several coloring styles
'
' Thd default fill and blank colors
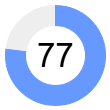
fillColor = &H6699ff
blankColor = &Heeeeee
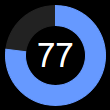
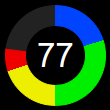
If chartIndex >= 4 Then
' Use dark background style
Call m.setColors(cd.whiteOnBlackPalette)
blankColor = &H222222
End If
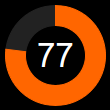
If chartIndex Mod 4 = 1 Then
' Alternative fill color
fillColor = &Hff6600
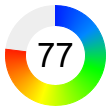
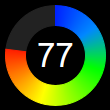
ElseIf chartIndex Mod 4 = 2 Then
' Use a smooth color scale as the fill color
smoothColorScale = Array(0, &H0022ff, 15, &H0088ff, 30, &H00ff00, 55, &Hffff00, 80, _
&Hff0000, 100, &Hff0000)
fillColor = m.getDrawArea().angleGradientColor(Int(m.getWidth() / 2), Int(m.getHeight() / _
2), 0, 360, radius, radius - 20, smoothColorScale)
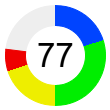
ElseIf chartIndex Mod 4 = 3 Then
' Use a step color scale as the fill color
stepColorScale = Array(0, &H0044ff, 20, &H00ee00, 50, &Heeee00, 70, &Hee0000, 100)
fillColor = m.getDrawArea().angleGradientColor(Int(m.getWidth() / 2), Int(m.getHeight() / _
2), 0, 360, radius, radius - 20, stepColorScale)
End If
' Draw the blank part of the circular bar
If angle < 360 Then
Call m.addRingSector(radius, radius - 20, angle, 360, blankColor)
End If
' Draw the fill part of the circular bar
If angle > 0 Then
Call m.addRingSector(radius, radius - 20, 0, angle, fillColor)
End If
' Add a label at the center to display the value
Call m.addText(Int(m.getWidth() / 2), Int(m.getHeight() / 2), m.formatValue(value, "{value}"), _
"Arial", 25, cd.TextColor, cd.Center).setMargin(0)
' Output the chart
Call viewer.setChart(m, cd.SVG)
End Sub
' This example includes 8 charts
Dim viewers(7)
For i = 0 To Ubound(viewers)
Set viewers(i) = cd.WebChartViewer(Request, "chart" & i)
Call createChart(viewers(i), i)
Next
%>
<!DOCTYPE html>
<html>
<head>
<title>Circular Bar Meters</title>
<!-- Include ChartDirector Javascript Library to support chart interactions -->
<script type="text/javascript" src="cdjcv.js"></script>
</head>
<body style="margin:5px 0px 0px 5px">
<div style="font:bold 18pt verdana;">
Circular Bar Meters
</div>
<hr style="border:solid 1px #000080; background:#000080" />
<div style="font:10pt verdana; margin-bottom:1.5em">
<a href="viewsource.asp?file=<%= Request("SCRIPT_NAME") %>">View Chart Source Code</a>
</div>
<!-- ****** Here are the chart images ****** -->
<%
For i = 0 To Ubound(viewers)
Call Response.Write(viewers(i).renderHTML())
Call Response.Write(" ")
Next
%>
</body>
</html>
© 2021 Advanced Software Engineering Limited. All rights reserved.