Track Cursors Clickable Charts Zooming/Scrolling Real-Time Charts
Pie Charts Bar Charts Line Charts Area Charts Trending Charts Box Charts Scatter Charts 3D Scatter Charts Contour Charts Surface Charts Discrete Heat Maps Tree Map Charts Bubble Charts Vector Charts Gantt Charts Finance Charts Polar Charts Radar Charts Pyramids/Funnels Combo Charts Angular Meters Linear Meters
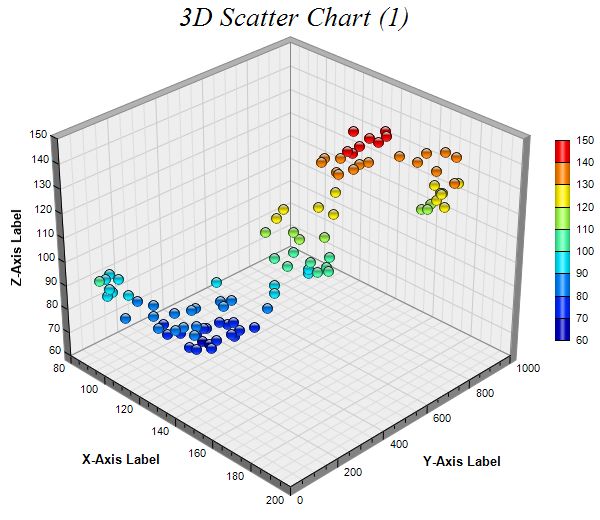
- A 3D scatter chart with the symbols colored based on their z-values.
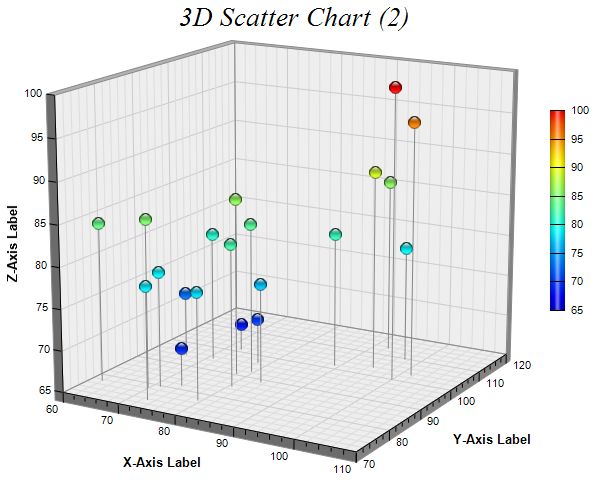
- A 3D scatter chart with the symbols colored based on their z-values using a continuous color scale. In addition, drop lines are added to help visualizing the 3D positions of the symbols.
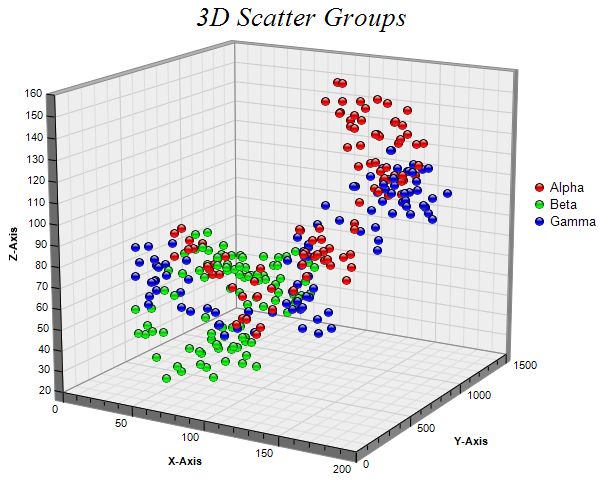
- A 3D scatter chart with different groups of symbols represented using different colors.
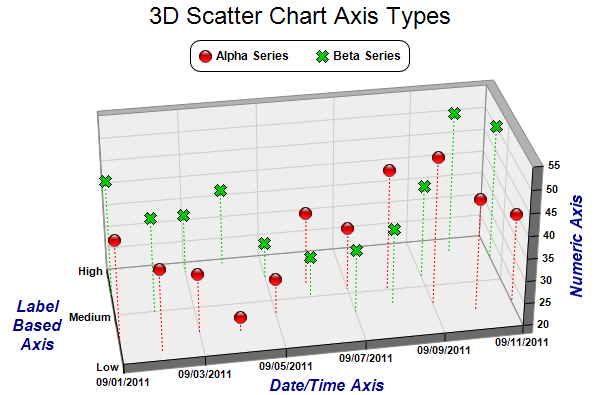
- This chart illustrates the different axis types supported by ChartDirector - label based axis, date/time axis and numeric axis.
- Two groups of symbols represented using different shapes and colors, are included in this chart, and drop lines of matching colors are added to help visualization.