ChartDirector
Chart and Graph Plotting Library
C++, .NET, C#, VB, ASP, COM, Java, PHP, Perl, Python
Samples of the chart types supported by the ChartDirector chart component.
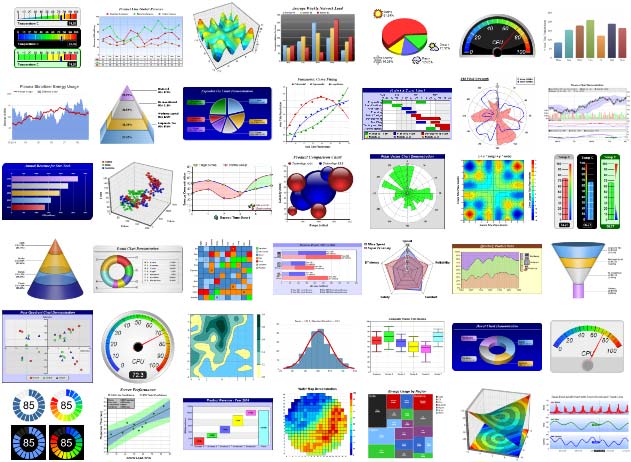
Extensive Chart Types
Pie, donut, bar, line, spline, step line, regression, curve-fitting, inter-line filling, area, band, scatter, bubble, floating box, box-whisker, waterfall, contour, heat map, discrete heat map, tree map, surface, vector, finance, Gantt, radar, polar, rose, pyramid, cone, funnel ... even includes meters and gauges.
Layered Architecture
Combine multiple chart layers to plot combo charts and graphs. You can also use layers to add symbols to highlight specific points, add markers, thresholds, zones, error bands ... The possibilities are endless.
Create charts with multiple chart layers.
Real time interactive charts with track cursors, zoomable and scrollable and
				with viewport control.
Real-Time Interactive Charts
Create real-time charts with programmable track cursors, rich formatted tooltips, zooming and scrolling interface, viewport controls, clickable hot spots and custom mouse and touch event handlers.
Big Data Charts
Up to 1,000,000,000 Points Per Chart
ChartDirector's unique architecture allows multiple threads to work on a single chart. ChartDirector can plot millions of points quickly, even for data that updates in real-time. All the while the user can zoom in to see individual points and zoom out to see the whole picture, with track cursor that displays the details as the chart updates.
Real-time charts with up to 1 billion data points
ChartDirector PDF Reports
PDF Reports
In addition to charts, ChartDirector can draw free form text, tables, shapes and images, and export them as a multi-page PDF document. With these capabilities, ChartDirector can be used to generate PDF reports too.
Standard Output Formats
Apart from displaying on screen, charts be created as PDF, SVG, as well as PNG, JPG, GIF and BMP images, both in memory and as files. This means you can export the charts to other applications, send the charts by email, generate the charts in batch jobs or store them in a database as records.
Create charts in PDF, SVG, PNG, JPG, GIF and BMP formats.
Supports C++, .NET, C#, VB, ASP, Java, PHP, Perl, Python. Works on Windows, Linux, macOS.
Universal
ChartDirector is suitable for various application types (desktop, web, console, batch, realtime ...) and supports many programming languages and operating systems. This means your investment in ChartDirector will be useful for your current as well as future projects.
Get More
Information
Download
Free Trial
Visit Chart
Gallery
© Advanced Software Engineering Ltd