General Features
Features common to all programming language editions of ChartDirector
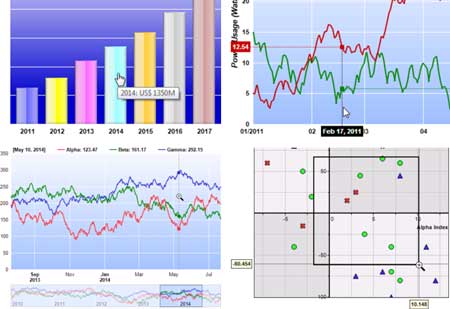
Extensive Chart Types
Pie, donut, bar, line, spline, step line, trend line, curve-fitting, inter-line filling, area, band,
scatter, bubble, floating box, box-whisker, waterfall, contour, continuous and discrete heat maps,
tree map, surface, vector, finance, Gantt, radar, polar, rose, pyramid, cone, funnel ...
Layered Architecture
Synthesize the charts you want with multiple chart layers.
Use layers to plot combo charts, add special symbols, marks
and labels to charts, highlight data points, add error bars ...
Meters and Gauges
Angular meters of configurable angle range and orientation - semicircle, circular,
120 degrees ... Linear meters with pointers and bars in horizontal and vertical
orientations.
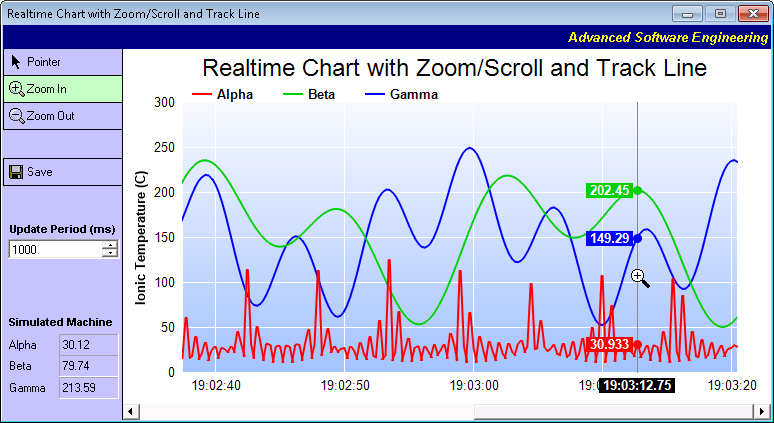
Programmable Track Cursor
Add sweep lines that track the mouse or finger, displaying data values in the
legend, axis or floating text boxes. Programmable behaviour for utmost
flexibility.
Zoom and Scroll Interface
Zoom and scroll by mouse dragging, mouse wheel, clicking or tapping, or use the
Viewport Control to visualize and select the data range. Also support external
controls such as scroll bars, sliders and date pickers.
Interactive Hot Spots
Chart objects (data points, legend items, custom labels, etc) can be configured
as hot spots. They can have tooltips, are clickable and can generate mouse
events for custom user interactions.
Rich Formatted Tooltips
Tooltips can be formatted using an HTML like mark up language. They can use
multiple fonts and colors, can be semi-transparent, and can include shapes,
images and even other charts.
Real-Time Charts
Plot charts and graphs that update in real-time with zooming and scrolling,
programmable track cursors and snapshots.
Big Data Charts - Up to 1,000,000,000 Points Per Chart
The C++ and .NET editions of ChartDirector includes data acceleration technology
that allows multiple threads to work on a single chart. ChartDirector can plot
millions of points quickly, even for data that updates in real-time. All the while
the user can zoom in to see individual points and zoom out to see the whole picture,
with track cursor that displays the details as the chart updates.
PDF Report Generation
In addition to charts, ChartDirector can draw free form text, tables, shapes and
images, and export them as a multi-page PDF document. With these capabilities,
ChartDirector can be used to generate PDF reports too.
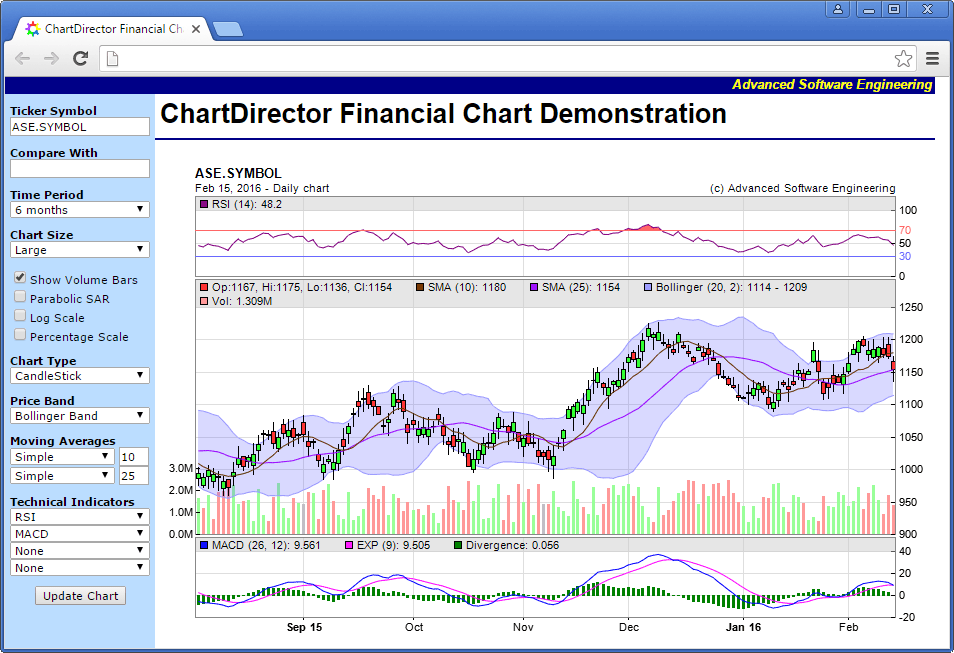
Financial Library with Source Code
Include sophisticated financial charting library with 47 technical indicators.
Extensible and customizable, and comes with source code. Also includes an
Interactive Financial Chart sample program.
Standard Output Formats
Apart from displaying on screen, charts be created as PDF, SVG, as well as PNG,
JPG, GIF and BMP images, both in memory and as files. You can stream the charts
directly to browsers, export the charts to other applications that support these
formats, send the charts by email, generate the charts in batch jobs or store them
in a database as records.
Unparalleled Customizability
Comprehensive object oriented API allows you to customize every chart details. Text and labels
can be marked up with tags to include icons and images, and to set fonts, colors,
layout, alignment, line-spacing, wrapping, truncation ... Fill objects with solid colors
as well as patterns, gradients or other dynamic colors. Unlimited number of XY axes per chart,
with automatic, semi-automatic and manual scaling ...
Versatile and Universal
The ideal chart and graph component in the developer's toolbox for your current and future
projects. Suitable for desktop, web, client/server, console, batch, background and other
application types. Supports .NET (C#, VB and other CLI languages), C++, Java, JSP, ASP, COM,
VB, VBScript, VBA, PHP, Python and Perl. Works on Windows, Linux, macOS and operating systems
that support Java.